WOC 331
Page 331
Writing in Math
Have you ever ordered a single scoop of ice cream and gotten a cone with three scoops packed into it? It’s nice when the server has trouble with math. You ask about it, and the person says, “We want you to be 1000 percent satisfied.” That’s mathematically impossible. But when you taste the new pineapple and cherry flavor, it is 10 times better than any flavor you’ve ever had, so perhaps 100 percent satisfied times 10 will make you 1000 percent satisfied?
Math helps you quantify your world (a single-scoop ice cream cone) as well as qualify it (10 times better). And writing helps you think about math. This chapter shows how.
What’s Ahead
WOC 332
Page 332
Math Table
A math table organizes data in a way that allows calculations to occur. You can build a math table in a spreadsheet or word processing program, or even by hand. Theo Jones uses this table to present data that he gathered about the week in weather.
Table
This Week in Weather
Beginning:
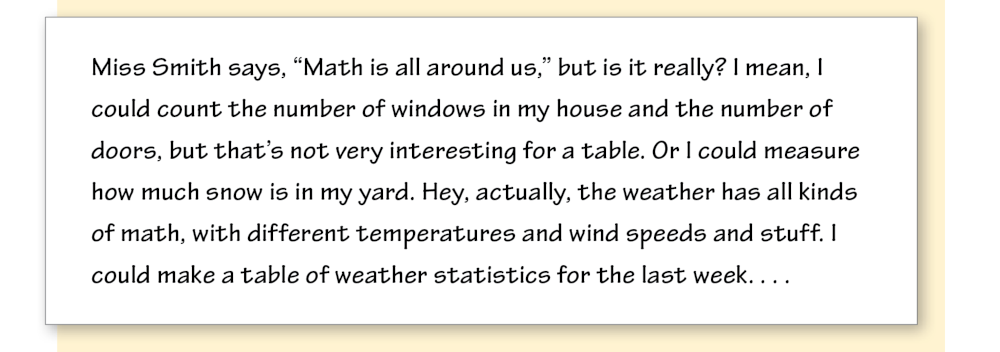
The writer introduces the table. Meteorologists measure a whole set of changing statistics, from highs and lows to wind speed and wind chill, as well as inches of snow. This table shows the weather details for this week.
Middle:
Data appear in rows and columns. Weather Statistics for the Week
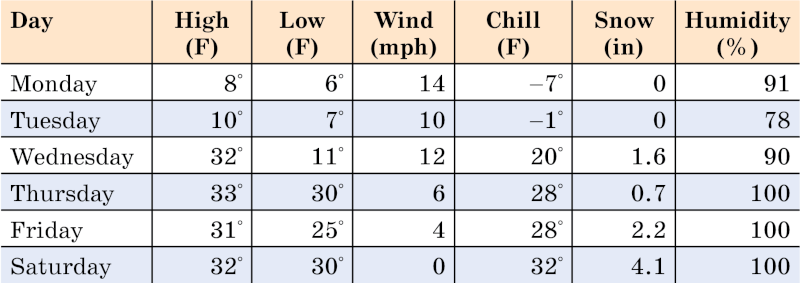
EndingThe writer offers observations based on the data. Humidity and Snowfall: When the humidity reaches 100 percent, water will precipitate. When the temperature is at freezing, water will tend to fall as snow or freezing rain.
Single-Digit Temperatures: When the air is really cold, it can’t hold much humidity. It looks like colder temperatures tend to have less precipitation than warmer temperatures.
Wind Speed and Wind Chill: The speed of wind is the main factor in wind chill. However, the correlation between miles per hour and degrees is not one for one:
- A 4 mph wind can make air feel 3° F colder.
- A 10 mph wind can make air feel 12° F colder.
- A 14 mph wind can make air feel 15° F colder.
Snow Totals: When temperatures are above freezing, the snow is wet and heavy. An inch of wet, heavy snow can contain more water than two inches of light, fluffy snow.
WOC 333
Page 333
Writing Guidelines
You can use math to measure the world around you.
Prewriting ■ Exploring a Math Term
Freewrite about real-world things that you could measure or count in a table.
Writing ■ Developing the First Draft
Beginning ■ Give your table an interesting title and introduce the math that it will show.
Middle ■ Label each row with the name of a topic you measured. Label each column with a trait that you measured. Place the data in the correct cells.
Ending ■ Write ending paragraphs to analyze the table.
Revising ■ and Editing ■ Improving Your Writing
Add, cut, rearrange, and rework parts of your table to make it clear and correct. Then check your measurements and calculations to remove any errors. (Download a checklist.)
_____ Does the table have a clear title and introduction?
_____ Have I used consistent units of measure?
_____ Are my data points in the right cells?
_____ Is all of my math correct?
_____ Have I checked punctuation, capitalization, and spelling?
_____ Does my table have an appealing design?
WOC 334
Page 334
Statistical Analysis
A statistical analysis examines a set of numbers and shows what they mean. In this analysis, Dana Rivers tracks the midterm exam scores of 107 math students.
Histogram Analysis
Beginning
The writer explains the graphic. The following histogram shows the midterm exam scores for Mr. Hanko’s 7th grade math classes.
Middle
A histogram presents the statistics.
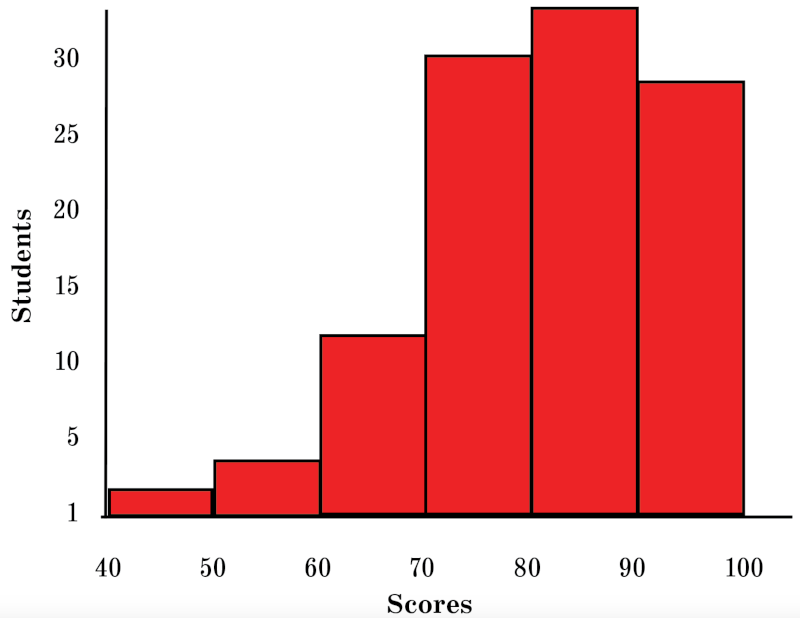
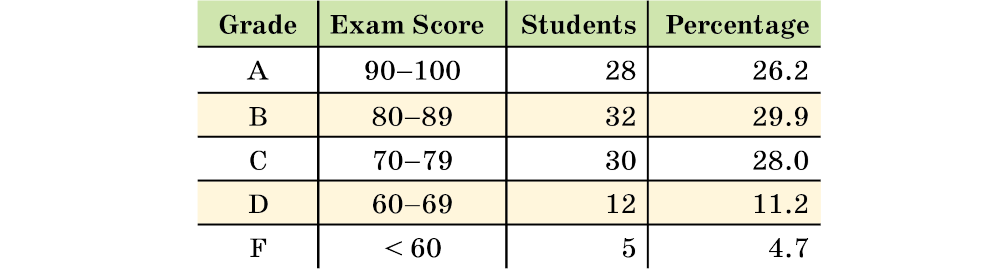
The student analyzes the data. Mr. Hanko has 107 students in his 7th grade math classes. All students scored between 40 and 100 on the midterm exam, with this breakdown of scores:
- Score 40–49: 2 students (1.9 percent)
- Score 50–59: 3 students (2.8 percent)
- Score 60–69: 12 students (11.2 percent)
- Score 70–79: 30 students (28.0 percent)
- Score 80–89: 32 students (29.9 percent)
- Score 90–100: 28 student (26.2 percent)
Ending:
The final paragraph sums up the statistics. Most students (84.1 percent) scored a 70 or above. The majority of students (95.3 percent) passed the exam. The 4.7 percent that failed have been assigned extra credit.
WOC 335
Page 335
Writing Guidelines
You can use math to measure the world around you.
Prewriting ■ Exploring a Math Term
Research your topic and gather statistics. Then organize the numbers in a math table like the one you made on page 332.
Writing ■ Developing the First Draft
Beginning ■ Catch the reader’s interest and give a summary of the statistics you will analyze.
Middle ■ Present your statistics and analyze what the numbers mean. Help the reader understand them, perhaps with a graphic.
Ending ■ Thoughtfully wrap up your essay.
Revising ■ and Editing ■ Improving Your Writing
Use the following checklist to improve your essay.
_____ Have I clearly explained the statistics?
_____ Do I include surprising insights to show what the numbers mean?
_____ Do transition words connect my ideas?
_____ Has a classmate reviewed my draft and helped me revise it?
_____ Have I carefully checked numbers, punctuation, capitalization, spelling, usage, and grammar?
WOC 336
Page 336
Other Math Forms
Your handbook can help you create these other forms of math writing:
- Classroom notes (pages 463–468): Write down formulas, terms, tips, and tricks that you learn from math class.
- Learning log (pages 135–137): Think about what you are learning in math and how it applies to your life.
- Summary (pages 294–295): Read an article that contains a lot of numbers. Then summarize the numbers for readers.
- Explanatory essay (pages 167–176): Explain how to solve a specific type of mathematical problem.
- Argument essay (pages 199–208): State a position and use statistics and math to convince readers to agree with you.
- Story (pages 263–272): Write an adventure story in which a hero uses math to solve problems, fight monsters, and win the day!
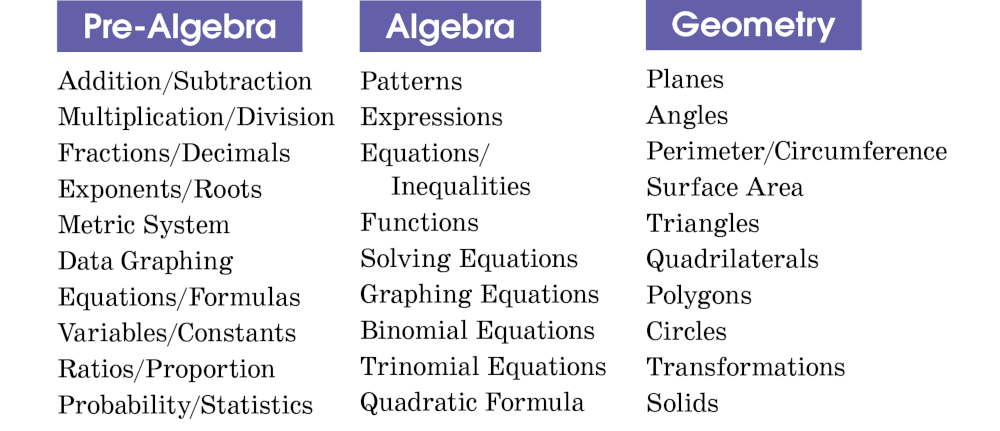
Math Subjects
Next time that you need to write a formal paper in math, think about these broad subject areas. Choose one and find a specific, interesting topic.