WOC 397
Page 397
Reading Graphics
Graphics provide a lot of information in a very small space. Drivers have to glance at a roundabout diagram and, in seconds, figure out which turn to take. Meteorologists need to read weather maps and see patterns of humidity, temperature, and precipitation. When you read a graphic, you need to come up with the thousand words that the picture is worth.
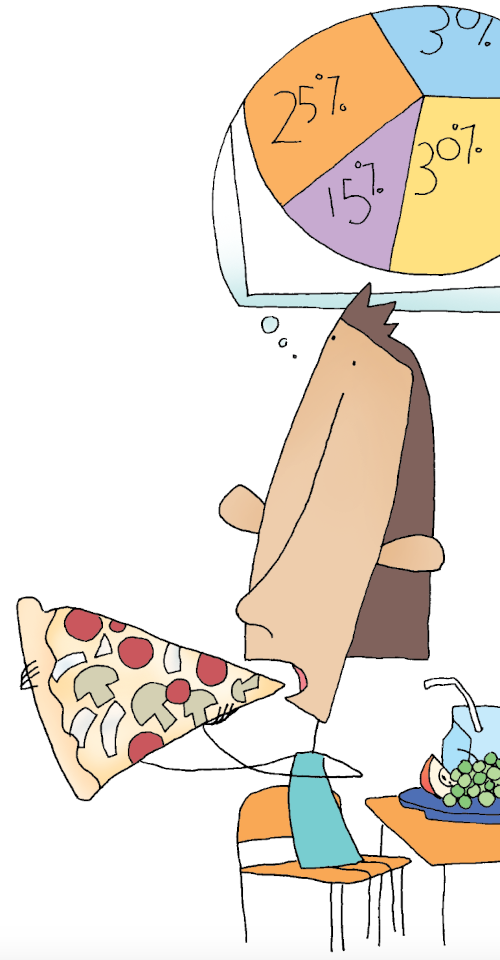
In this chapter, you’ll learn about symbols, graphs, tables, and diagrams. Each of these graphics communicates information in different ways. And take a moment to appreciate this graphic: a pie graph within an illustration of a student eating a pizza pie!
What’s Ahead
WOC 398
Page 398
Reading Graphic Information
When you look at a graphic, you want to first see the big picture. That means that you will want to know what the topic is, what the graphic is saying, and whether the information adds something new or is just there to clarify. Here are some guidelines you can use when you are trying to read graphics.
Quick Guide to Reading Graphics
- First, look at the graphic as a whole and try to get the big picture.
- Next, read the title, labels, and headings to get a better idea of what the graphic is about.
- Read what it says inside the graphic and look for important information.
- Read the “key” or any special notes included with the graphic.
- Finally, read the paragraph above or below the graphic to gather more information.
Reading Graphics in Advertisements
Graphics that are used to promote or advertise a product or idea require special attention. Sometimes these ads purposely leave information out or tilt things to convince you. This is common in both political and product ads.
Here are some questions you can ask:
- What is the purpose of the graphic?
- What does the graphic tell me (or not tell me)?
- What is the source of the information? Is it reliable?
- Are any parts of the graphic misleading?
- Overall, how trustworthy is the graphic?
WOC 399
Page 399
Understanding Symbols
The drawings used in picture writing are called “symbols.” A symbol is a simple picture or drawing that stands for something else.
Picture Symbols
It’s easy to tell what a symbol means when it looks just like the thing it stands for.

Signs and Symbols
Sometimes symbols stand for things that you can’t really draw a picture of—like the equal sign (=). In this case, the symbol stands for an idea; everybody who understands basic math knows that = means “equals.” Here are a few examples of signs and symbols used in different subjects. How many do you know?

Helpful Hint
Each subject has its own set of symbols. When you learn to read music, you learn what flats and sharps (and even double sharps) look like and mean. Learning new symbols helps you grasp new ideas and skills.
WOC 400
Page 400
Understanding Graphs
Graphs are pictures of information, not pictures of things. The information in graphs is often called data. The most common kinds of graphs are line graphs, pie graphs, and bar graphs.
Line Graph
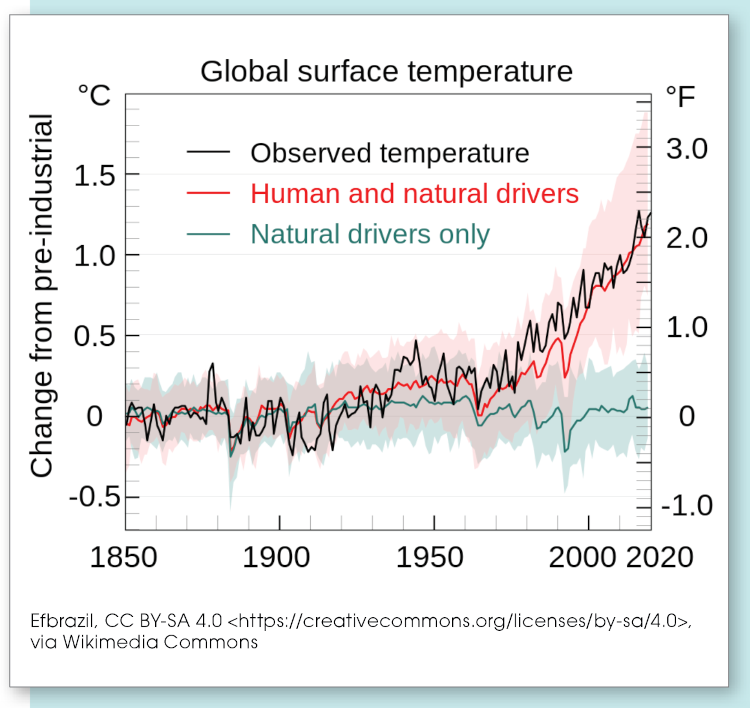
A line graph shows how things change over time. It starts with an L-shaped grid. The horizontal line of the grid stands for passing time (seconds, minutes, years, or even centuries). The vertical line of the grid shows the subject of the graph. The subject of this graph is the change in global surface temperature.
Pie Graph
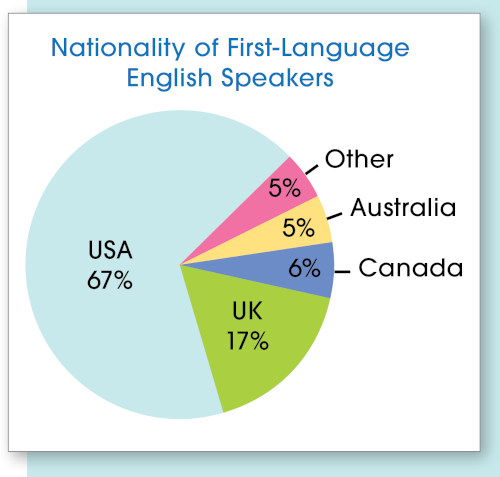
A pie graph shows proportions and how each proportion, or part, relates to the other parts and to the whole “pie.” In this pie graph, you can see what percentage of first-language English speakers come from particular regions of the world.
If percentages are used, they should add up to 100 percent; if numbers are used, the graphs may add up to some other total.
WOC 401
Page 401
Bar Graph
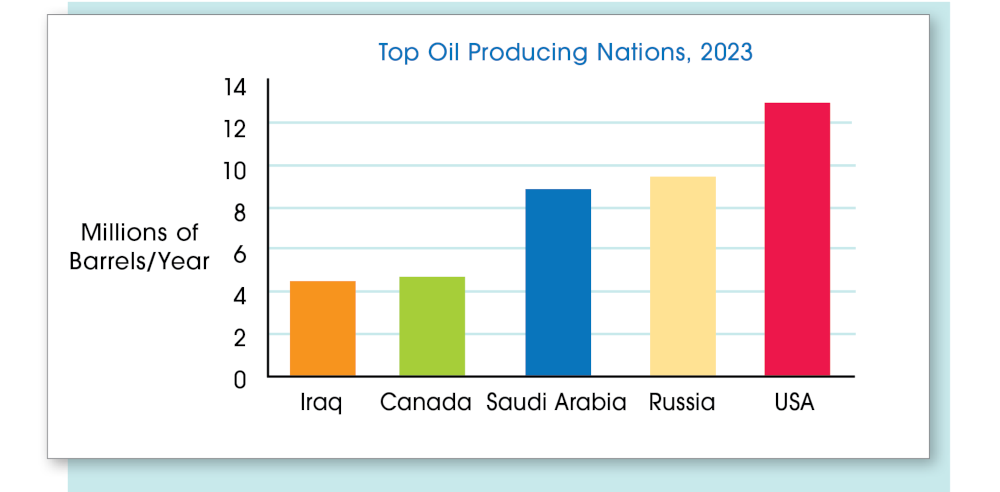
A bar graph uses bars (sometimes called columns) to show how different things compare to one another at the same time. The horizontal line shows what is being compared. The vertical line shows what the comparison is about.
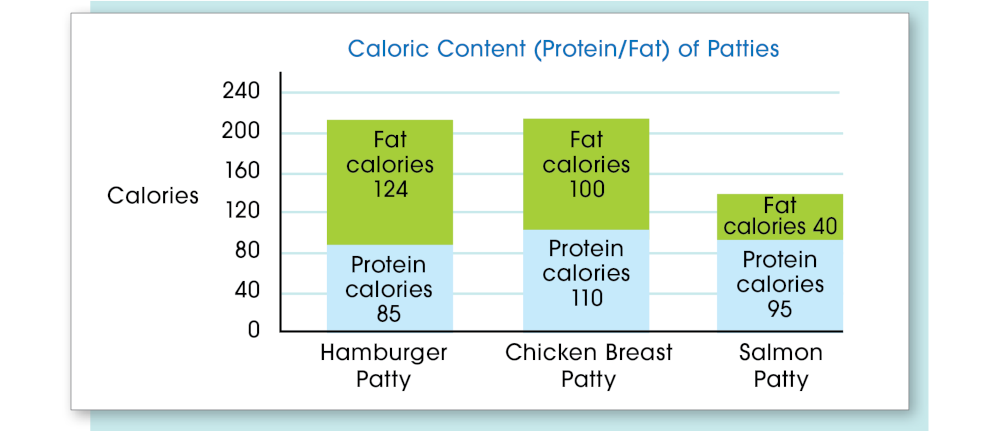
Stacked Bar Graph
A stacked bar graph gives more detailed information than a regular bar graph. Besides comparing the bars, it compares parts within the bars themselves.
WOC 402
Page 402
Understanding Tables
Tables organize words and numbers so that it’s easy to see how they relate to one another. Each table has rows (going across) and column (going down). Rows contain one kind of information, while columns contain another kind of information. Comparison tables, distance tables, and conversion tables are three common types, although you can build your own table to meet a special need.
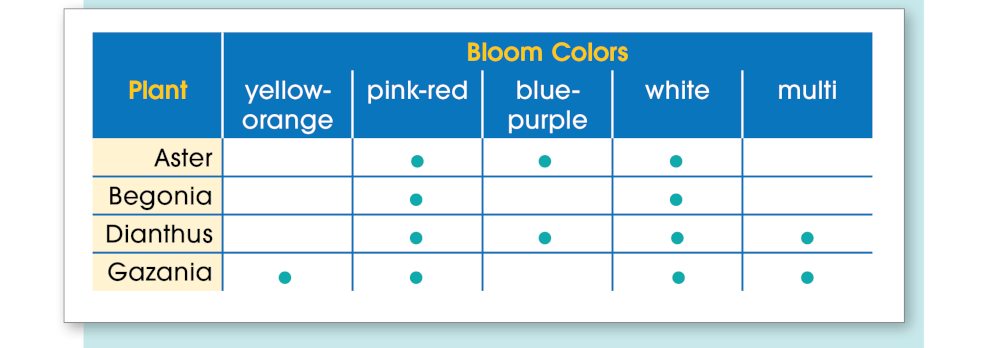
Comparison Table
The comparison table below is a comparison table that makes it easy to see the bloom color of different plants. The rows show kinds of plants; the columns show colors. (A • means that a plant has flowers of that color.)
Distance Table
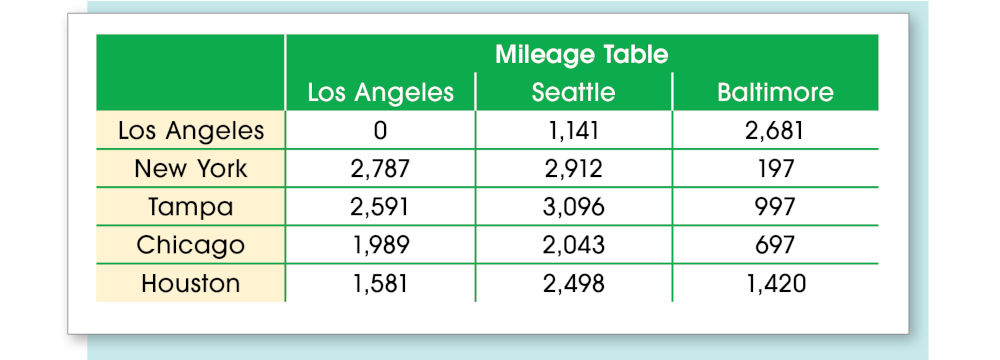
Another common kind of table is a distance or mileage table. To read a distance table, find your starting point in the row and your destination in the column (or the other way around). Where the row and column meet, find the distance between the two locations.
WOC 403
Page 403
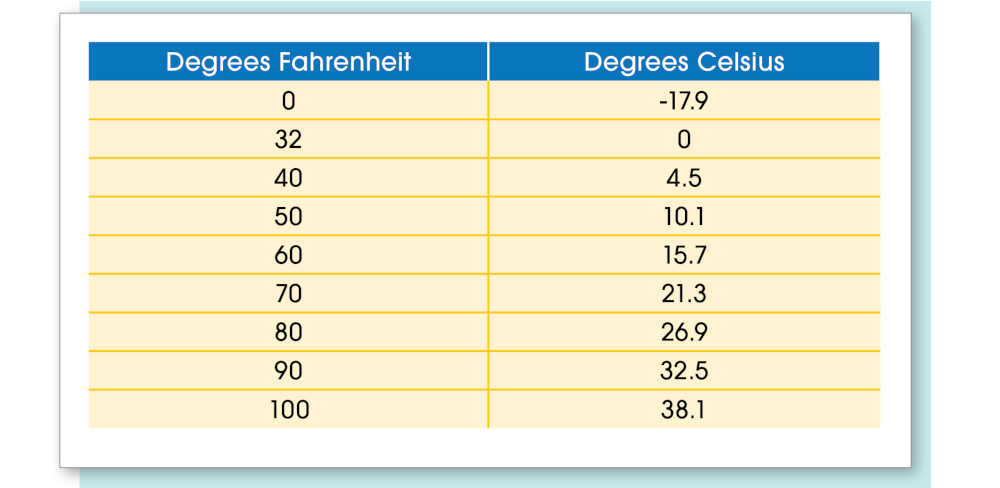
Conversion Table
Another very useful table is a conversion table. This is a table that converts (changes) information from one form to another. The table below converts degrees Fahrenheit to degrees Celsius. (The formula is to subtract 32 from Fahrenheit and multiply by .56 to find Celsius.)
Custom-Made Tables
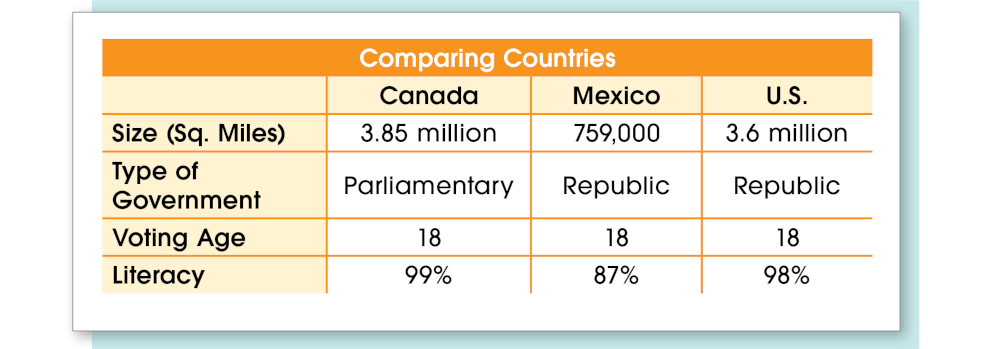
Tables are a good way to record all kinds of information. Imagine that you need to gather facts about several different countries and then compare some of the information. You could make a custom-made table like the one below.
WoC 404
Page 404
Understanding Diagrams
A diagram is a drawing that shows how something is put together, how its parts relate to one another, or how it works. The two most common types of diagrams are the picture diagram and the line diagram.
Picture Diagram
A picture diagram is just that—a labeled picture or drawing of the subject being discussed. Some parts of the subject may be left out of the diagram to emphasize the parts the writer wants to show. For example, this picture diagram of a cell shows only the largest, most important parts.

Line Diagram
Another type of diagram is a line diagram. A line diagram uses lines, symbols, and words to show the relationship between ideas. The problem-solving diagram below helps you understand how to solve a scientific problem. Note: When a diagram shows a process, it usually shows the steps from top to bottom (as in the example below) or from left to right.
