44 Reading Graphics

Page
331
from

Reading Graphics Opening Page

Start-Up Activity

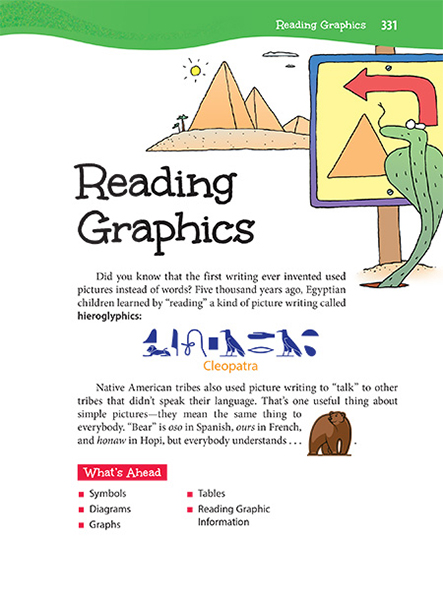
Discuss with your students that one of the first forms of writing actually used pictures instead of words. More than 5,000 years ago, Egyptians used a kind of picture writing called hieroglyphics. Later, Native American tribes used picture writing to communicate with other tribes that didn't speak their language.

Display some examples of Native American pictographs for your class. Have your students create a sentence or brief story using pictographs. Afterward, ask for volunteers to present their stories. Challenge the rest of the class to figure them out.

Inform students that this chapter will teach strategies for figuring out the meaning of many different types of visual information.

Think About It

“Information presented in a graphic helps readers see patterns, relationships, and trends.”

Page 332 from Writers Express

Symbols

Discuss the role of symbols in society. Point out some of the different reasons for symbols (to give directions, to caution against hazards, to evoke feeling, to express belonging, to sell products).

Challenge students to list three symbols not shown on the page and what they stand for. Ask for volunteers to share their lists with the class.

Finally, point out that dictionaries have a special section for signs and symbols. Students can use this section to discover the meaning of unknown symbols.

LAFS Standard:
TEKS Standard:
NE ELA Standard:

Related Resource Tags

Click to view a list of tags that tie into other resources on our site

Page 333 from Writers Express

Diagrams

Lead your students through the three types of diagrams on the page. Explain that students can use diagrams to analyze the different parts of a topic. You can use the related minilesson to provide specific directions for creating a line diagram. When students create their own diagrams, remind them to take care in labeling each part correctly.

LAFS Standard:
TEKS Standard:
NE ELA Standard:

Related Resource Tags

Click to view a list of tags that tie into other resources on our site

Page 334 from Writers Express

Graphs

Review the purpose and function of bar graphs. Then discuss the specific parts of the sample bar graphs on this page. As an activity, have students create a bar graph that compares the types of pets your students own. For example, the bar graph could show how many students own dogs versus cats versus other pets.

LAFS Standard:
TEKS Standard:
NE ELA Standard:

Related Resource Tags

Click to view a list of tags that tie into other resources on our site

Page 335 from Writers Express

Graphs (Continued)

Review the guidelines for creating a line graph. Point out the important parts of the sample, including the subject (Number of Guppies), the time measurement (months), and the line direction, which shows the change in number over time.

As an activity, provide your class with data on the average monthly high temperature for your region of the country. Challenge students to create a line graph that plots the average high temperature for each month, starting with January.

LAFS Standard:
TEKS Standard:
NE ELA Standard:

Related Resource Tags

Click to view a list of tags that tie into other resources on our site

21st Century Skills:

Page 336 from Writers Express

Graphs (Continued)

Discuss the purpose of pie graphs and analyze the sample. As an activity, have students complete the minilesson highlighted below.

Complete your discussion of graphs by reviewing the quick guide.

LAFS Standard:
TEKS Standard:
NE ELA Standard:

Related Resource Tags

Click to view a list of tags that tie into other resources on our site

Page 337 from Writers Express

Tables

Show students how they can use tables to display information. Then review the two types of tables on this page.

  • A schedule shows the date and time that something occurs.
  • A distance table shows how far one place is from another.

As an activity, have students analyze the sample distance table to discover the distance to and from the following locations:

  • New York to Seattle (2,912)
  • Baltimore to Los Angeles (2,701)
  • Seattle to Tampa (3,096)
  • Baltimore to New York (197)
LAFS Standard:
TEKS Standard:
NE ELA Standard:

Related Resource Tags

Click to view a list of tags that tie into other resources on our site

Page 338 from Writers Express

Tables (Continued)

Review the conversion table. Inform students that almost every other country in the world follows the metric system, so it is important to have a basic understanding of it. The sample table on this page can help. Have students use the table to convert their height from inches to centimeters. (They may need a calculator for this activity.)

Finally, show students how to make custom tables. Time permitting, introduce digital software for creating tables (Microsoft Excel, Google Sheets, etc.). Consider collaborating with your school's media specialist on this lesson.

LAFS Standard:
TEKS Standard:
NE ELA Standard:

Related Resource Tags

Click to view a list of tags that tie into other resources on our site

Page 339 from Writers Express

Reading Graphic Information

As a class, review the guidelines for reading graphics and the special considerations for advertisements. Then split up your class into groups. Present each group with a graphic and have them practice the reading tips. Afterward, pick a spokesperson from each group to present their analysis of the graphic.

LAFS Standard:
TEKS Standard:
NE ELA Standard:

Related Resource Tags

Click to view a list of tags that tie into other resources on our site

21st Century Skills:

Page 340 from Writers Express

Reading Product Labels

Introduce students to the sample product label. Discuss how reading product labels can help students make informed decisions before making a purchase. For example, they could read the nutrition labels on two different brands of granola bars to compare their health value.

Next, see if students can correctly answer the four questions about the sample label:

  1. How many calories are in each serving? (250)
  2. How much fat does each serving contain? (7 grams)
  3. What percentage of your daily need of calcium is included? (20%)
  4. How much protein is contained in each serving? (5 grams)

Related Resource Tags

Click to view a list of tags that tie into other resources on our site