WT 226
Page 226
Reading Graphics
You see graphics every day: traffic signs on the way to school tell drivers how to be safe, diagrams in books show how something works, graphs online turn math into pictures, and tables in print provide many numbers in one place. Graphics open a world of information to you!
Look at That!
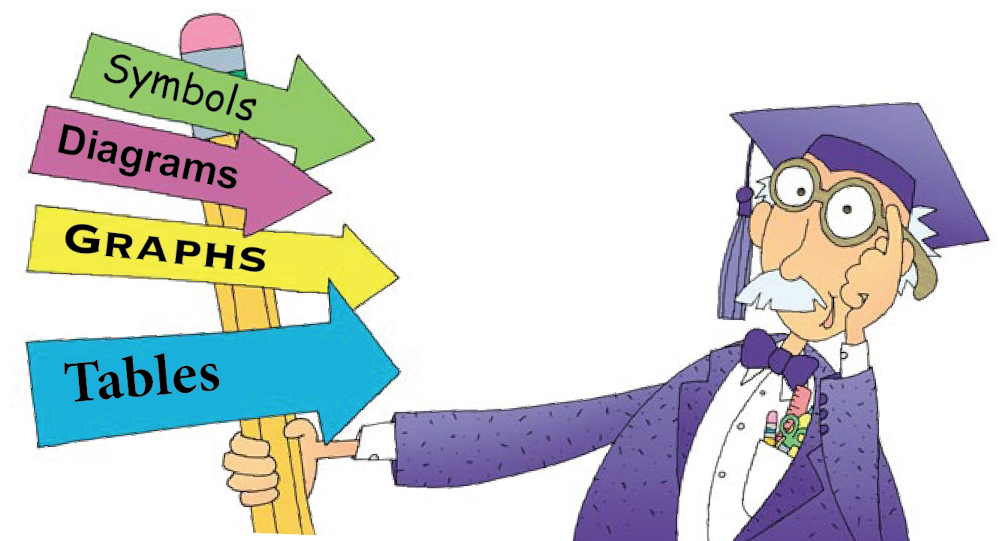
This chapter helps you read four different types of graphics: symbols, diagrams, graphs, and tables. Each type provides information in a visual form. When you read graphics, you get information . . . without all those words!

WT 227
Page 227
Learning About Symbols
A symbol is an image that stands for something. Symbols can be divided into two groups.
1. Some symbols stand for ideas or feelings.

2. Some symbols give information.

Tips for Understanding Symbols
🟪 Study the symbol and look for familiar parts.
🟪 Decide what it means.
🟪 Study the symbol and look for familiar parts.
🟪 Decide what it means.
What does each symbol on this page mean? (Check your answers below.)

WT 228
Page 228
Learning About Diagrams
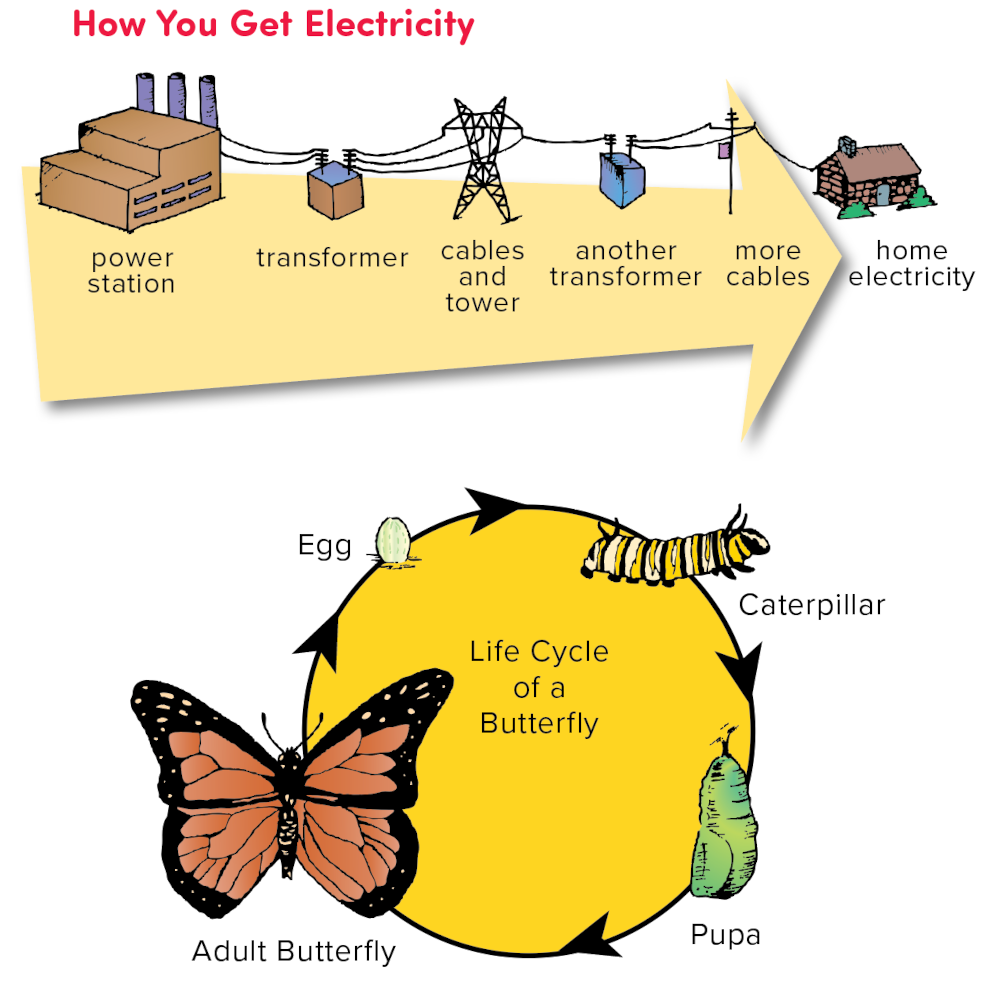
A diagram is a graphic that shows how something works or how something happens. When you read a diagram, be sure to check the labels and notice the direction of any arrows.

WT 229
Page 229
Learning About Bar Graphs
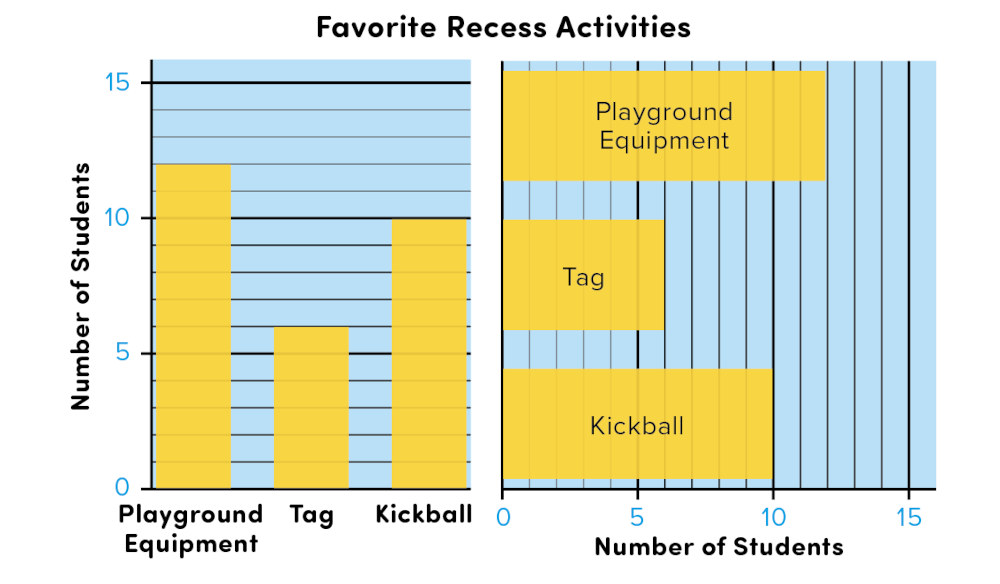
A bar graph shows how two or more things compare. The bars can go up and down or sideways. Both bar graphs below show the same thing. Of the 28 students, 12 prefer playground equipment, 10 like kickball, and 6 choose tag as their favorite recess activity.

Tips for Understanding Bar Graphs
🟪 Read the title to see what the graph is about.
🟪 Look at the labels for the bars. They tell what is being counted.
🟪 Look at the number scale (0, 5, 10, 15). Notice the lowest and highest numbers.
🟪 Notice how tall (or long) each bar is (12, 6, 10).
WT 230
Page 230
Learning About Tables
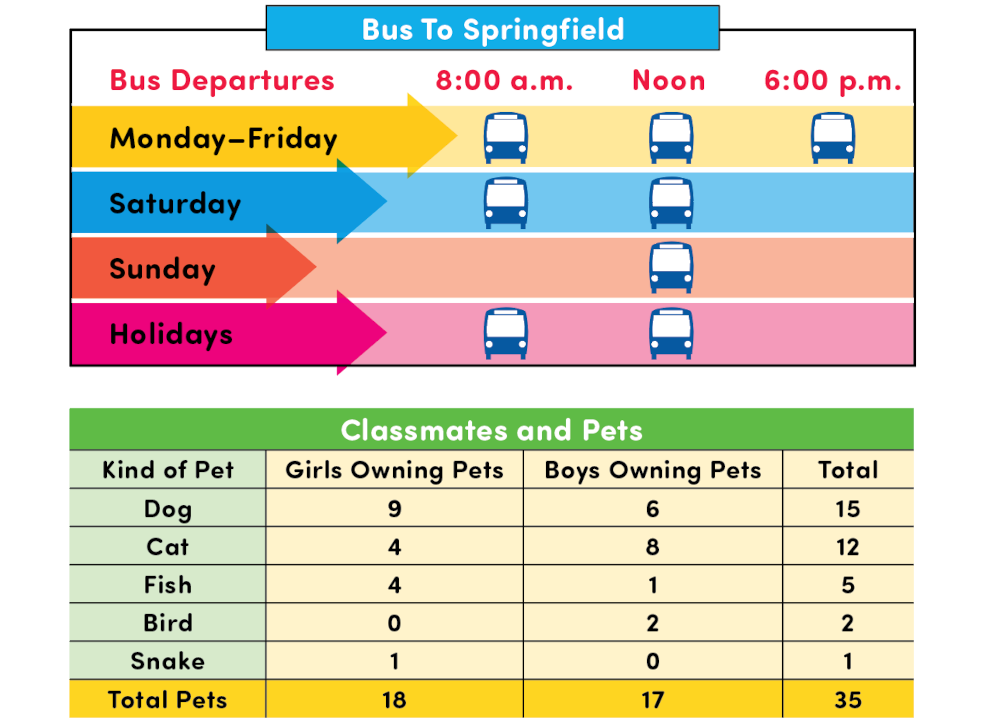
A table is a graphic that has two basic parts: rows go across, and columns go down. Here are two examples:
