Bookmark

Sign up or login to use the bookmarking feature.

Page 229

Learning About Bar Graphs

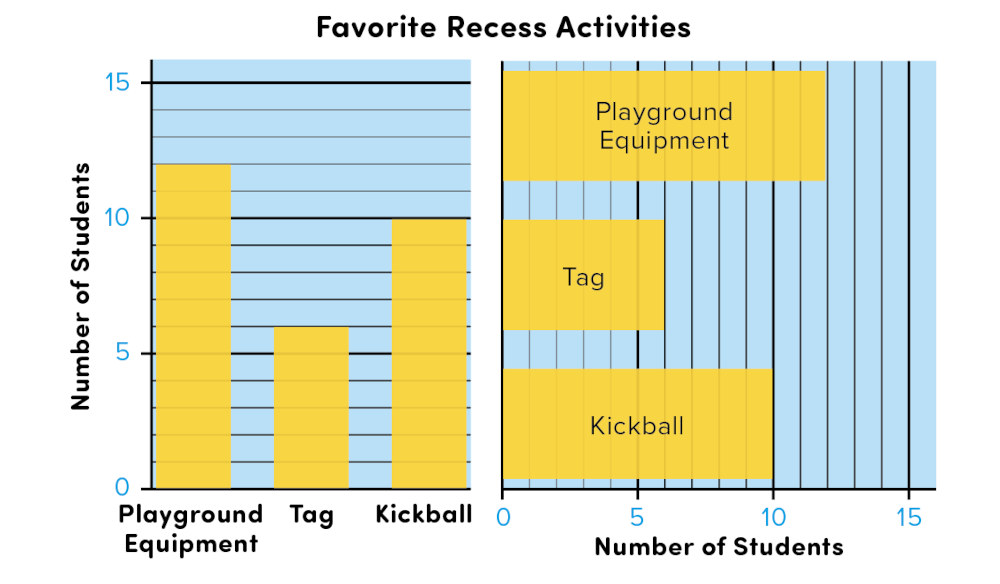
A bar graph shows how two or more things compare. The bars can go up and down or sideways. Both bar graphs below show the same thing. Of the 28 students, 12 prefer playground equipment, 10 like kickball, and 6 choose tag as their favorite recess activity.

Bar Graph Examples
Β© Thoughtful Learning 2025

Tips for Understanding Bar Graphs

    πŸŸͺ Read the title to see what the graph is about.
    πŸŸͺ Look at the labels for the bars. They tell what is being counted.
    πŸŸͺ Look at the number scale (0, 5, 10, 15). Notice the lowest and highest numbers.
    πŸŸͺ Notice how tall (or long) each bar is (12, 6, 10).

Β© 2025 Thoughtful Learning. Copying is permitted.

k12.thoughtfullearning.com