31 Reading Graphics

Page
431
from

Reading Graphics Chapter Opener

Start-Up Activity

Present students with this definition:

Graphics: Pictures of thinking

Ask students whether they agree with this definition.

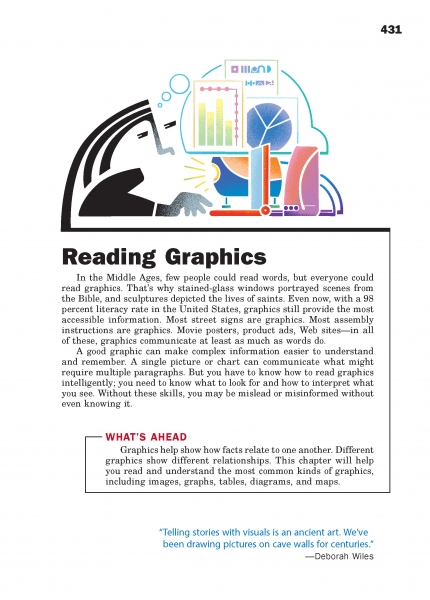
In essence, it points out that what we see in person is reality, and everything else is a graphic that allows us to think of things that aren't in front of us. Photos, videos, TV shows, paintings, drawings, charts, diagrams, flowcharts—all of these are pictures of thinking. They visually present someone else's thoughts.

As a result, students should not treat graphics as reality, simply letting the images flow into them. Instead, they should read graphics actively and critically. This chapter provides practice with closely reading many graphic forms.

Think About It

“The human mind grasps the world—even the most abstract, ethereal concepts—as a space filled with movable things and stuff. We say that John went from being sick to being well, even if he didn't move an inch. . . . Mary can give him many pieces of advice, even if they merely talked on the phone and nothing changed hands. Even scientists, when they try to grasp abstract mathematical relationships, plot them in graphs that show them as two- and three-dimensional shapes. Our capacity for abstract thought has co-opted the coordinate system and inventory of objects made available by a well-developed visual system.”

—Steven Pinker

Page 432 from Write for College

Reading Graphic Information

Just like nonfiction and literature, graphics are forms of communication. Someone created them to communicate about a specific topic for a specific reason. As a result, students should not simply let graphics flash before them, but should critically engage them and think about the communication situation. Have them use the PAST questions to explore the Purpose, Audience, Subject, and Type of each graphic.

Then lead students through the five steps of interacting with a graphic. Afterward, have them consider the "Inside Info" feature, which isolates common parts of graphics. Students need to learn to dissect graphics to fully understand them.

LAFS Standard:
NE ELA Standard:

Related Resource Tags

Click to view a list of tags that tie into other resources on our site

English Language Arts:

Page 433 from Write for College

Reading Images

For many students, the challenge of reading images is that the process seems instantaneous. Help them slow the process down and actively engage what they see.

For example, have them carefully study the image of the tornado. Ask them about the . . .

  • Colors Dark gray clouds, brown vortex, green fields, all in daylight
  • Composition A twisting column of destruction connecting the roiling heavens to the placid earth
  • Mood Threat, awe, warning, terror

Students might object that such dissection reads too much into the image. The photo is just whatever the camera saw. Remind students that the photographer chose to take that shot and probably selected it from dozens or hundreds of others. The person then sold the shot to an online service that offered it for sale. A publisher purchased it from thousands of other options and placed it on page 433 of Write for College, with the express purpose of using it to teach about reading images. In other words, though this picture may be "just whatever the camera saw," the image has been selected many times from thousands of options because it communicates something.

Have students perform the same sort of dissection of the second image on the page, and the colored etching by William Blake. Then have students compare "The Ancient of Days" to the tornado photograph. (Both deal with a powerful force reaching down out of the turbulent heavens toward earth; both employ similar forms and colors; both evoke awe; etc.) Ask them also to contrast the images. (One is a photo and the other an etching; one is modern and the other old; one shows a destructive natural force and the other a creative supernatural force; etc.)

LAFS Standard:
NE ELA Standard:

Related Resource Tags

Click to view a list of tags that tie into other resources on our site

English Language Arts:

Page 434 from Write for College

Reading Advertisements

Rampant capitalism and contentious politics have churned out two centuries worth of advertising. Students need to develop very critical minds to sort the trustworthy appeals from the manipulative, deceptive, and downright false claims that surround them. Starting with historic examples can allow students to hone their skills with non-controversial topics before addressing the more challenging topics of the day.

Have students dissect each ad on this page, focusing on images, appeals, composition, mood, and veracity (how honest the information is). You can facilitate their work with the Ad Evaluation Sheet or the minilesson.

Downloads:
LAFS Standard:
NE ELA Standard:

Related Resource Tags

Click to view a list of tags that tie into other resources on our site

English Language Arts:

Page 435 from Write for College

Reading Graphs

Graphs organize information visually so that readers can see trends in data. Different types of graphs work well to show different types of relationships. As the "Inside Info" feature on this page shows, most spreadsheet programs allow users to output data in a variety of graph forms.

Review with students the ways that line graphs and pie graphs present information. Then have them search magazines, textbooks, and Web sites to find published examples of each type of graph.

You can also use the minilesson to help students experiment with creating their own pie graphs.

LAFS Standard:
NE ELA Standard:

Related Resource Tags

Click to view a list of tags that tie into other resources on our site

English Language Arts:

Page 436 from Write for College

Stacked and Multiple Bar Graphs

Use this page to teach students how to read stacked and multiple bar graphs. Both graphs on this page show the same information. However, the first graph helps viewers compare overall casualties in WWII while the second helps viewers compare military and civilian casualties. Which version do students find more helpful in understanding the cost of the war for different nations?

Have students search their textbooks for bar graphs of different types and analyze the data they show. Also ask them how the data would differ if it had been presented in another type of bar graph.

LAFS Standard:
NE ELA Standard:

Related Resource Tags

Click to view a list of tags that tie into other resources on our site

English Language Arts:

Page 437 from Write for College

Analyzing Tables

Tables display data in rows and columns. The cell where a row and column meets contains information that applies to both the row and the column. Word processing programs can easily create tables for most writing projects, but students will want to use spreadsheet programs for projects that require manipulating data.

Lead students through the two specialty types: comparison tables and gradient tables.

Ask students to find different types of tables in published material and compare the ways that the tables provide information.

LAFS Standard:
NE ELA Standard:

Related Resource Tags

Click to view a list of tags that tie into other resources on our site

English Language Arts:

Page 438 from Write for College

Reading Diagrams

A diagram provides a pictorial representation of information, showing forms, positions, relationships, scales, parts, and so on.

When the Pioneer spacecraft left Earth, they carried these golden plaques with them, providing diagrams to help aliens understand who we are, where we are, and what we know. Analyze the design of this image, reading the description and researching further online, if desired. Then ask students whether they would find the diagram helpful in understanding humanity. Have them take 15 minutes to design their own golden plaques to ride on the next spacecraft that will exit our solar system. What images would they include, and why?

Have students next analyze the organizational diagram. They can experiment with creating their own line diagrams by using the minilesson.

LAFS Standard:
NE ELA Standard:

Related Resource Tags

Click to view a list of tags that tie into other resources on our site

English Language Arts:

Page 439 from Write for College

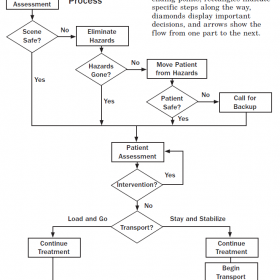
Reading Flowcharts

Flowcharts take line diagrams one step farther, adding movement through steps of a process.

Review with students the description of each shape in a flowchart. (For more information, see page 386.) Then review the sample flowchart, tracing the decision points for a first-responder to an accident.

You can use the minilesson to help students create their own flowcharts.

LAFS Standard:
NE ELA Standard:

Related Resource Tags

Click to view a list of tags that tie into other resources on our site

English Language Arts:

Page 440 from Write for College

Reading Maps

The proliferation of GPS navigation aids hasn't eliminated the need for map-reading skills. In fact, you'll find more types of maps now than before. Google Maps alone allows you to move from global satellite views down to "walk" the streets of places around the globe. Students need to learn to navigate virtual worlds in order to navigate the real world.

Lead them through the instruction on this page. Then have students find maps of places that interest them and analyze them. Ask them to use the map to tell how to navigate, step by step, from one key location to another. Have students share their map discoveries with each other.

LAFS Standard:
NE ELA Standard:

Related Resource Tags

Click to view a list of tags that tie into other resources on our site

English Language Arts: