Minilesson Print
Comparing with a Venn Diagram

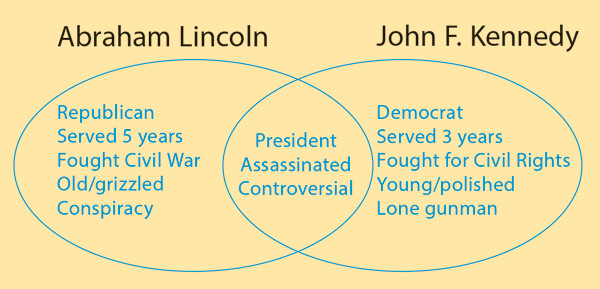
Abraham Lincoln and John F. Kennedy were alike in some ways, but they had quite a few differences. In this Venn diagram, the similarities between the two presidents appear where the circles overlap, and the differences appear where the circles do not.
You can use a Venn diagram to analyze the similarities and differences between any two topics. For example, how were World War I and World War II similar? How were they different? Or how are mammals and birds similar? How are they different?
Your Turn Create a Venn diagram to compare and contrast two topics you are studying. This activity helps you create this graphic organizer by hand, but you could also download the Venn diagram template at the bottom of this minilesson.
- Think about two subjects that you need to compare and contrast.
- On a piece of paper, draw two overlapping circles (or ovals).
- Write one subject above the left circle and the other subject above the right circle.
- How are the subjects similar? Write ideas in the space where the circles overlap.
- How are the subjects different? Write differences in the spaces that don't overlap, underneath the appropriate subject.
- When you write a difference under one subject, try to write a contrasting difference under the other subject.

Comparing with a Venn Diagram by Thoughtful Learning is licensed under a Creative Commons Attribution-NonCommercial-ShareAlike 4.0 International License.
Based on a work at k12.thoughtfullearning.com/minilesson/comparing-venn-diagram.