
smit, 2015 / Shutterstock.com
We all want students to think critically about the subjects we teach, but how can we make it happen? What does deeper thinking look like in English language arts, science, social studies, and math?
One way to see students' thinking is to have them create graphic organizers. Each graphic organizer that follows requires your students to use different critical thinking skills (in parentheses). Read about each organizer and the thinking it creates, and then click to see minilesson activities you can present to your students to get them thinking deeply.
Time Lines (Sequencing)
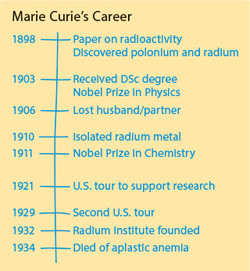
When your students create time lines, they sort details in chronological order. Of course, time lines work well for historical events, like this time line of the life of Madame Curie. But they also work well for helping students understand the steps in a process or the sequence of events in a short story or novel.
Have students write the topic at the top and then draw a vertical line. On the left of the line, they write dates, numbers (1, 2, 3, 4 . . .), or even words like "First," "Next," and "Then." On the right of the line, students write events in time order. The minilesson activity has a document download that you can use as well.
View "Sequencing with a Timeline" Minilesson
Pro-Con Charts (Evaluation)

If you want students to evaluate the good and bad aspects of a topic, get them to create a pro-con chart. This chart explores the pros and cons of the Westward Expansion in U.S. history. You can also have students analyze a character from a novel or think deeply about an issue for an argument essay.
Have students write the topic at the top of a piece of paper and draw a large T shape under it. Afterward, they should label the left column "Pro" and use it for positives and label the right column "Con" and use it for negatives. If you would rather hand out a printout or have students work electronically, check out the document download in the minilesson activity.
View "Evaluating with a Pro-Con Chart" Minilesson
Cause-Effect Charts (Causation)
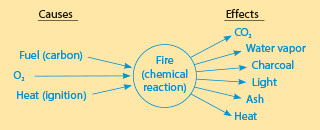
When students think about causes and effects, they tend to think in a very linear fashion: The bat hits the ball and sends it over the fence. But many topics have much more complex webs of cause and effect. A chart like this one, which analyzes the causes and effects of fire, helps students sort out those complexities. Imagine having students analyze the causes and effects of Katniss Everdeen's plight in The Hunger Games.
Have students write their topic in the middle of a page and circle it. Then have them write "Causes" above to the left and "Effects" above to the right. Under these labels, students list causes and effects and connect them to the topic using arrows. Or you can use the digital download available in the minilesson activity.
View "Analyzing with a Cause-Effect Chart" Minilesson
Venn Diagrams (Comparison and Contrast)
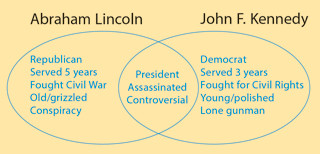
A good-old Venn diagram can help your students explore the ways that two topics are similar and the ways they are different. This diagram compares two American presidents who were assassinated. Your students can use the Venn diagram to compare two characters, two methods for doing a division problem, or any other topics with comparisons and contrasts.
Have students draw two overlapping circles (or ovals) and write one topic above each. Then have them list similarities in the overlapping section and differences in the outer parts. Encourage them to keep the differences parallel: When they write a detail in one side, they should write a contrasting detail in the other side. The minilesson activity includes a download of a Venn diagram template.
View "Comparing with a Venn Diagram" Minilesson
Line Diagrams (Classification)
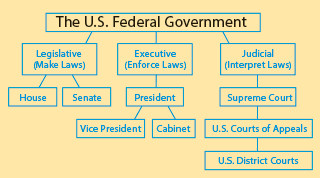
Creating a line diagram can help students analyze the parts of something and how those parts interconnect. This example shows the three branches of the U.S. federal government. Students could use line diagrams to analyze the structure of an organization, the relationships between members in a family, the taxonomy of a species, or even the different types of verbs (active, linking, and passive, with examples of each).
Have students write the topic at the top of the page in a centered box. Then have students break the topic into sub-categories by creating and connecting boxes beneath the first. Students can also have sub-sub-categories and so on. Or you can have students use the line diagram download in the minilesson activity.
View "Analyzing with a Line Diagram" Minilesson
Planning Sheets (Goal Setting)
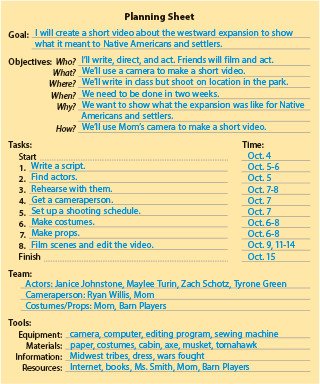
Teachers are masters of planning, but we rarely teach students directly how to do it. This planning sheet brings all of the details together in one spot. By walking step by step through the process of planning a project or activity, your students can think deeply about their work. This planning sheet helped a student plan a video project about the U.S. Westward Expansion. You can use this sheet to help students plan research reports, Web sites, community projects, or any other complex student-centered activity.
Download the planning sheet in the minilesson activity and provide it to students either on paper or digitally. Then lead them through the minilesson for filling out the sheet. The sheet not only helps them think about the project in advance, but it also helps you track their progress and make sure they stay on target.
You can use the sheet in your own planning as well, outlining a complex project for your students so that they fully understand your expectations. And once you or your students create a planning sheet, you have the start of a rubric for the project (see below).
View "Creating a Plan" Minilesson
Rubrics (Evaluation)
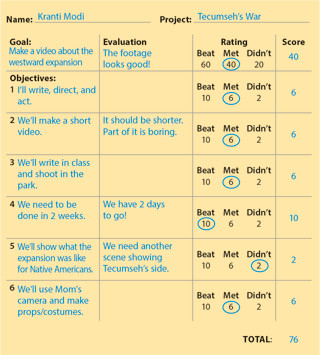
You can create a quick rubric for any project by writing the Goal (what students are doing and why) and creating Objectives (answering the 5 W's and H questions about the project: Who? What? Where? When? Why? and How?). If you or your students have used the planning sheet to prepare for the project, you've already created a goal and objectives. You'll just copy them into the first column of the rubric template.
The first column in the example rubric was created from the goal and objectives outlined in the planning sheet for the Westward Expansion video project. In the second column, a student reflected on how well he had met the goal and objective. In the third column, the student circled whether he Beat, Met, or Didn't meet the goal and objectives. By adding up the weighted score, the student arrived at a percentage score of the project. (Note that simply meeting expectations results in an average score: C. If a student exceeds expectation for the goal and all objectives, he or she will score 120 points, an A+. Or you can convert the 20 points into extra credit on the project—a great incentive to excel.)
Get the rubric sheet download in the minilesson activity, and use the activity to teach your students the vital skill of evaluation.