Minilesson Print
Analyzing with a Cause-Effect Chart

Some causes and effects are easy to sort out. The batter swings and hits the ball. It flies over the fence. He scores! The bat causes the ball to fly over the fence. The home run causes the score to increase.
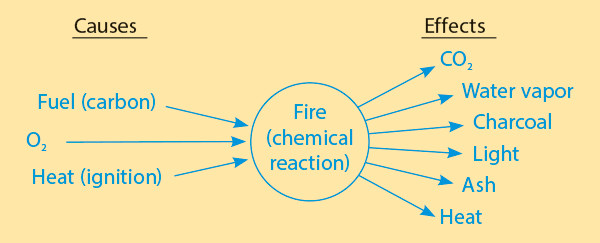
Other situations are more complex. In this chart, look at all the causes of fire and its effects. Now imagine trying to analyze something even more complex, like the causes and effects of the Civil Rights Movement, or what causes Bilbo Baggins to join the dwarf company and how this decision changes his life. A cause-effect chart like this one can help.
Your Turn Analyze the causes and effects of a topic you are currently studying. These instructions help you create a cause-effect chart by hand, but you can also download the template at the bottom of this minilesson.
- Write the name of your topic in the middle of a piece of paper and circle it.
- Above to the left, write "Causes" and above to the right, write "Effects."
- On the left side, list the causes of the topic and draw arrows pointing in toward the topic.
- On the right side, list the effects of the topic and draw arrows pointing out from the topic.
- Share your cause-effect chart with a classmate and discuss your analysis.

Analyzing with a Cause-Effect Chart by Thoughtful Learning is licensed under a Creative Commons Attribution-NonCommercial-ShareAlike 4.0 International License.
Based on a work at k12.thoughtfullearning.com/minilesson/analyzing-cause-effect-chart.