Student Model
AP Stats Project
The Republicans won in 2016 because of poverty and race. I compared voting Republican to poverty and number of non-Hispanic whites. I figured poverty was more important than race. I got the info from the census, health and human services, and the election maps.
It's only R=.508 to compare poverty and Republican votes. The least squares regression line is Predicted Republican Vote = 1.38*Poverty Rate+26.6. The residual plot for Poverty and Republican shows no pattern. The slope shows that more poverty by one percent = more votes by 1.38 percent. The y-intercept is at 26.6. California in an outlier with 16.4% poverty rate. The S value = 7.497. The r²= .258.It's only R= .442 for non-Hispanic white and Republicans. This shows how there is a positive relation. There's no outliers. Since there is no pattern in the residual plot. The least squares regression line is Predicted Republican Vote=.335^x+26.7. The slope shows that more non-Hispanic whites by one percent = more Republicans by about .335%. The Y-intercept is not necessary. S=7.806. The R²=.195.
Poverty Rate shows better who voted Republican because it has a higher R. Poverty Rate also doesn't have so much S value or error. The Y-intercept doesn't mean much because nobody has no poverty or no non-Hispanic whites. Still, Poverty Rate is kind of weak at only R=.508. There's probably other things that make people vote Republican.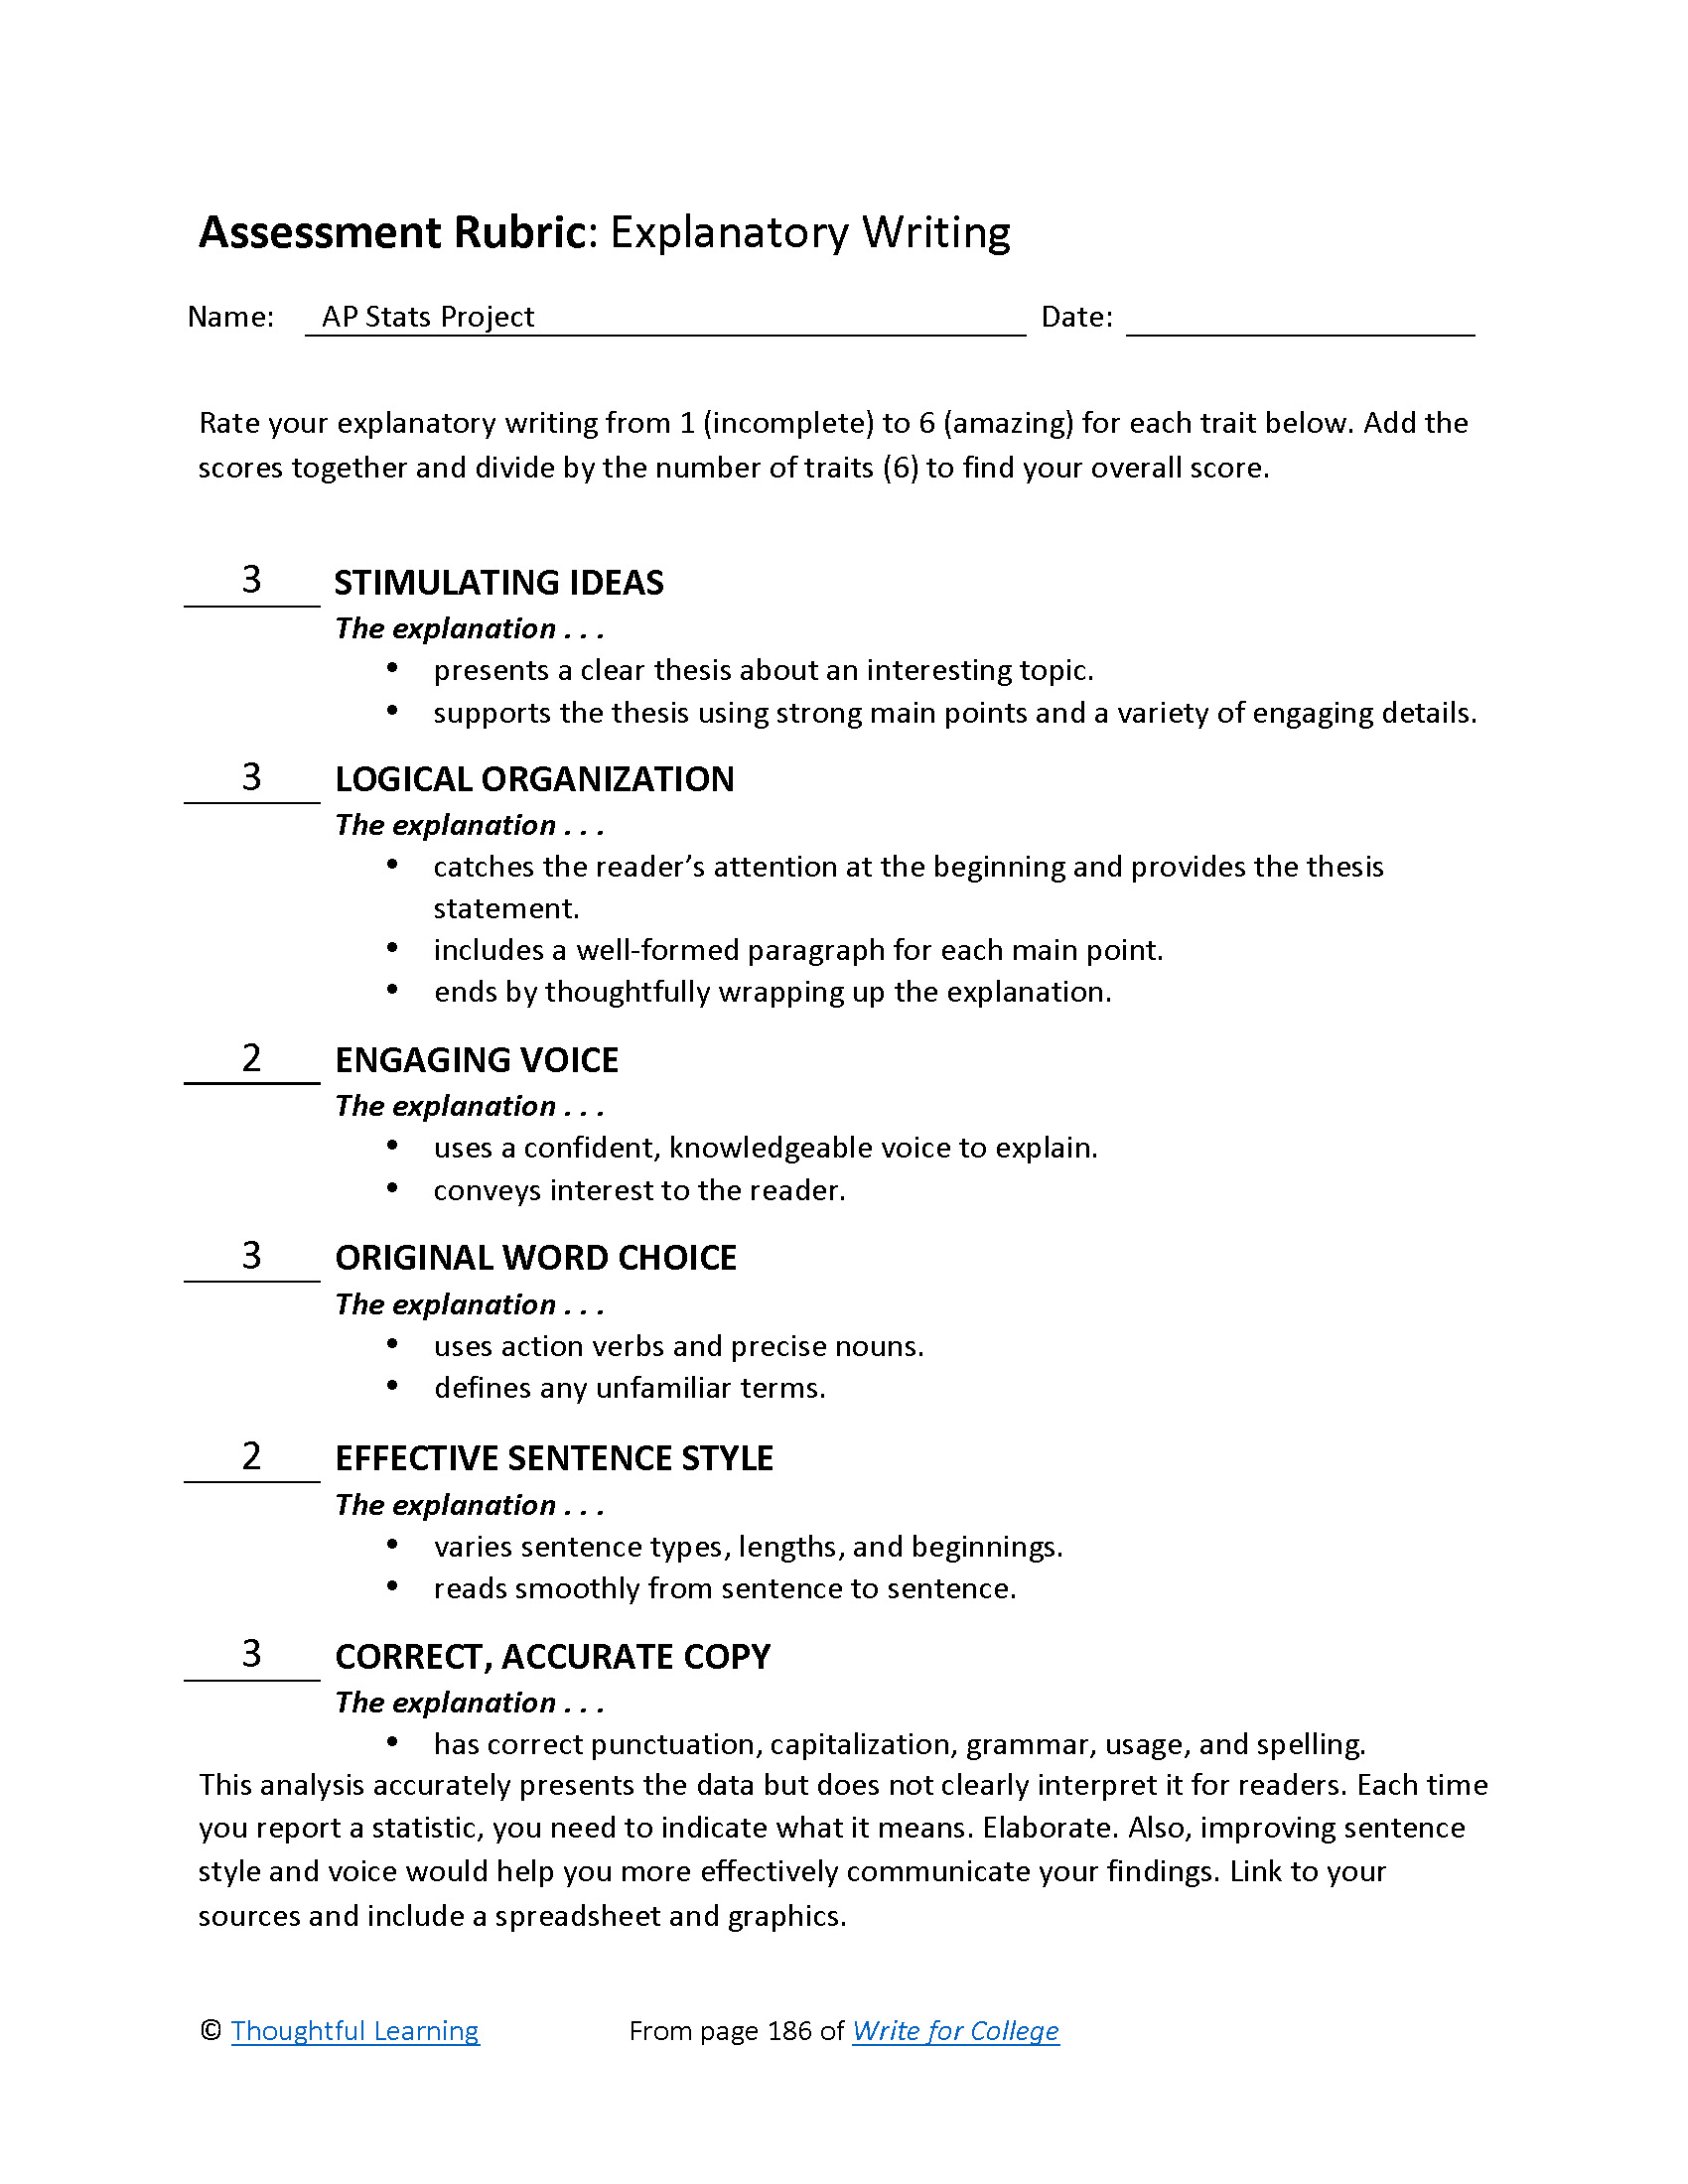
Rubric

AP Stats Project by Thoughtful Learning is licensed under a Creative Commons Attribution-NonCommercial-ShareAlike 4.0 International License.
Based on a work at k12.thoughtfullearning.com/assessmentmodels/ap-stats-project.