Student Model
Poverty and Race in the 2016 Election
Introduction:
The 2016 election was a narrow Republican Victory in the 2016 presidential Election. This has been attributed to the amount of poverty in each state, and the Non-Hispanic White population in the state. Using Census Data for 11 different states, I did a report on a state’s percent voting Republican in the 2016 presidential election, and their Poverty Rate and Non-Hispanic White Population. I believe that there will be a stronger correlation between Poverty Rate and voting Republican than Non-Hispanic White Population and voting Republican. The data was collected from the Census Data from 2014. .http://www.census.gov/prod/2001pubs/mso01-wp.pdf (US Census), "Income, Poverty and Health Insurance Coverage in the U.S.: 2014" (Department of Health and Human Services), and "Official 2016 Presidential General Election Results" (Election Commission). The data is shown in the Google Sheets attached.
Data Analysis:
The Poverty Scatterplot shows a not very strong, linear, and positive correlation since the R=.508. The equation for the least squares regression line is Predicted Republican Vote in the 2016 presidential election=1.38*Poverty Rate+26.6. The residual plot for Poverty and Republican shows no pattern which means that the linear solution is appropriate. The Slope shows that for every percent of a state's population in poverty would add about 1.38 percent of the vote toward the Republican Party. The y-intercept is at 26.6. This means that if there was no poverty rate in a state, than there would only be about 26.6% of the vote that would go to the Republican Party. However, it is highly unlikely that a State would have 0% for a poverty rate, so the y-intercept isn’t very meaningful to our data. The only possible outlier for Poverty and Republican Voting Rate is California. With 16.4% poverty rate, the amount the residual is much greater for the Republican Percentage. The S value = 7.497. So the average prediction error using the least squares regression line is about 7.497% votes for Republicans. Since the r2= .258 this means that 25.8% of the variation in the data for percent voting Republican in the 2016 Presidential Election. can be accounted for by the poverty rate in a state.The Non-Hispanic Scatterplot shows a not very strong, linear, and positive correlation since the R= .442. This shows how there is a positive relation. There doesn't appear to be outliers in this data set. Since there is no pattern in the residual plot, then it means the linear is appropriate for this model. The least squares regression line is Predicted Republican Vote=.335^x+26.7. The slope means that about .335% of the vote is added to Republicans per percent of Non-Hispanic White people in a state. The Y-intercept is not necessary to the data since no state will have a 0% Non-Hispanic White population. S=7.806 this means that the average prediction error using the least squares regression line is about 7.497% votes for the Republicans in the 2016 Presidential Race. The R2=.195 this means that 19.5% of the data variation in the data for percent voting republican can be accounted for by the Non-Hispanic White population.
Conclusion:
Out of the two variables, Poverty Rate is much better at predicting what percentage a state’s population will vote Republican in the 2016 presidential election. This is shown by the R value in Poverty Rate being higher than the non-hispanic white population variable. Poverty Rate is also much better the average prediction error or S value is smaller than the S value for the white population. The scatterplot for poverty even has an outlier and the data is more reliable. This data could have other points that account for the percent of Republican Voting such as the age of the voting population, the amount of people on welfare, or the education rates of the states. All of those characteristics also could affect what percent of population votes republican in the 2016 presidential election. It is dangerous to extrapolate with this data line. Going too low or too high is not a realistic situation for the states. This could mean that 0% of a state lives in poverty or that 30% of a state lives in poverty. Neither of these examples even exist in the United States,but it is also impossible to predict Republican vote in the 2016 presidential election based on these results. For example, this would mean that a poverty Rate of 33% would yield 72.1% of the States population voting Republican. This kind of a landslide is unheard of in the United States. Especially during a presidential race. While Poverty Rate is the better predictor for the percent of a population voting Republican, it is still not a strong correlation. Since the R=.508, I would suggest finding a variable that was more likely to cause this influence.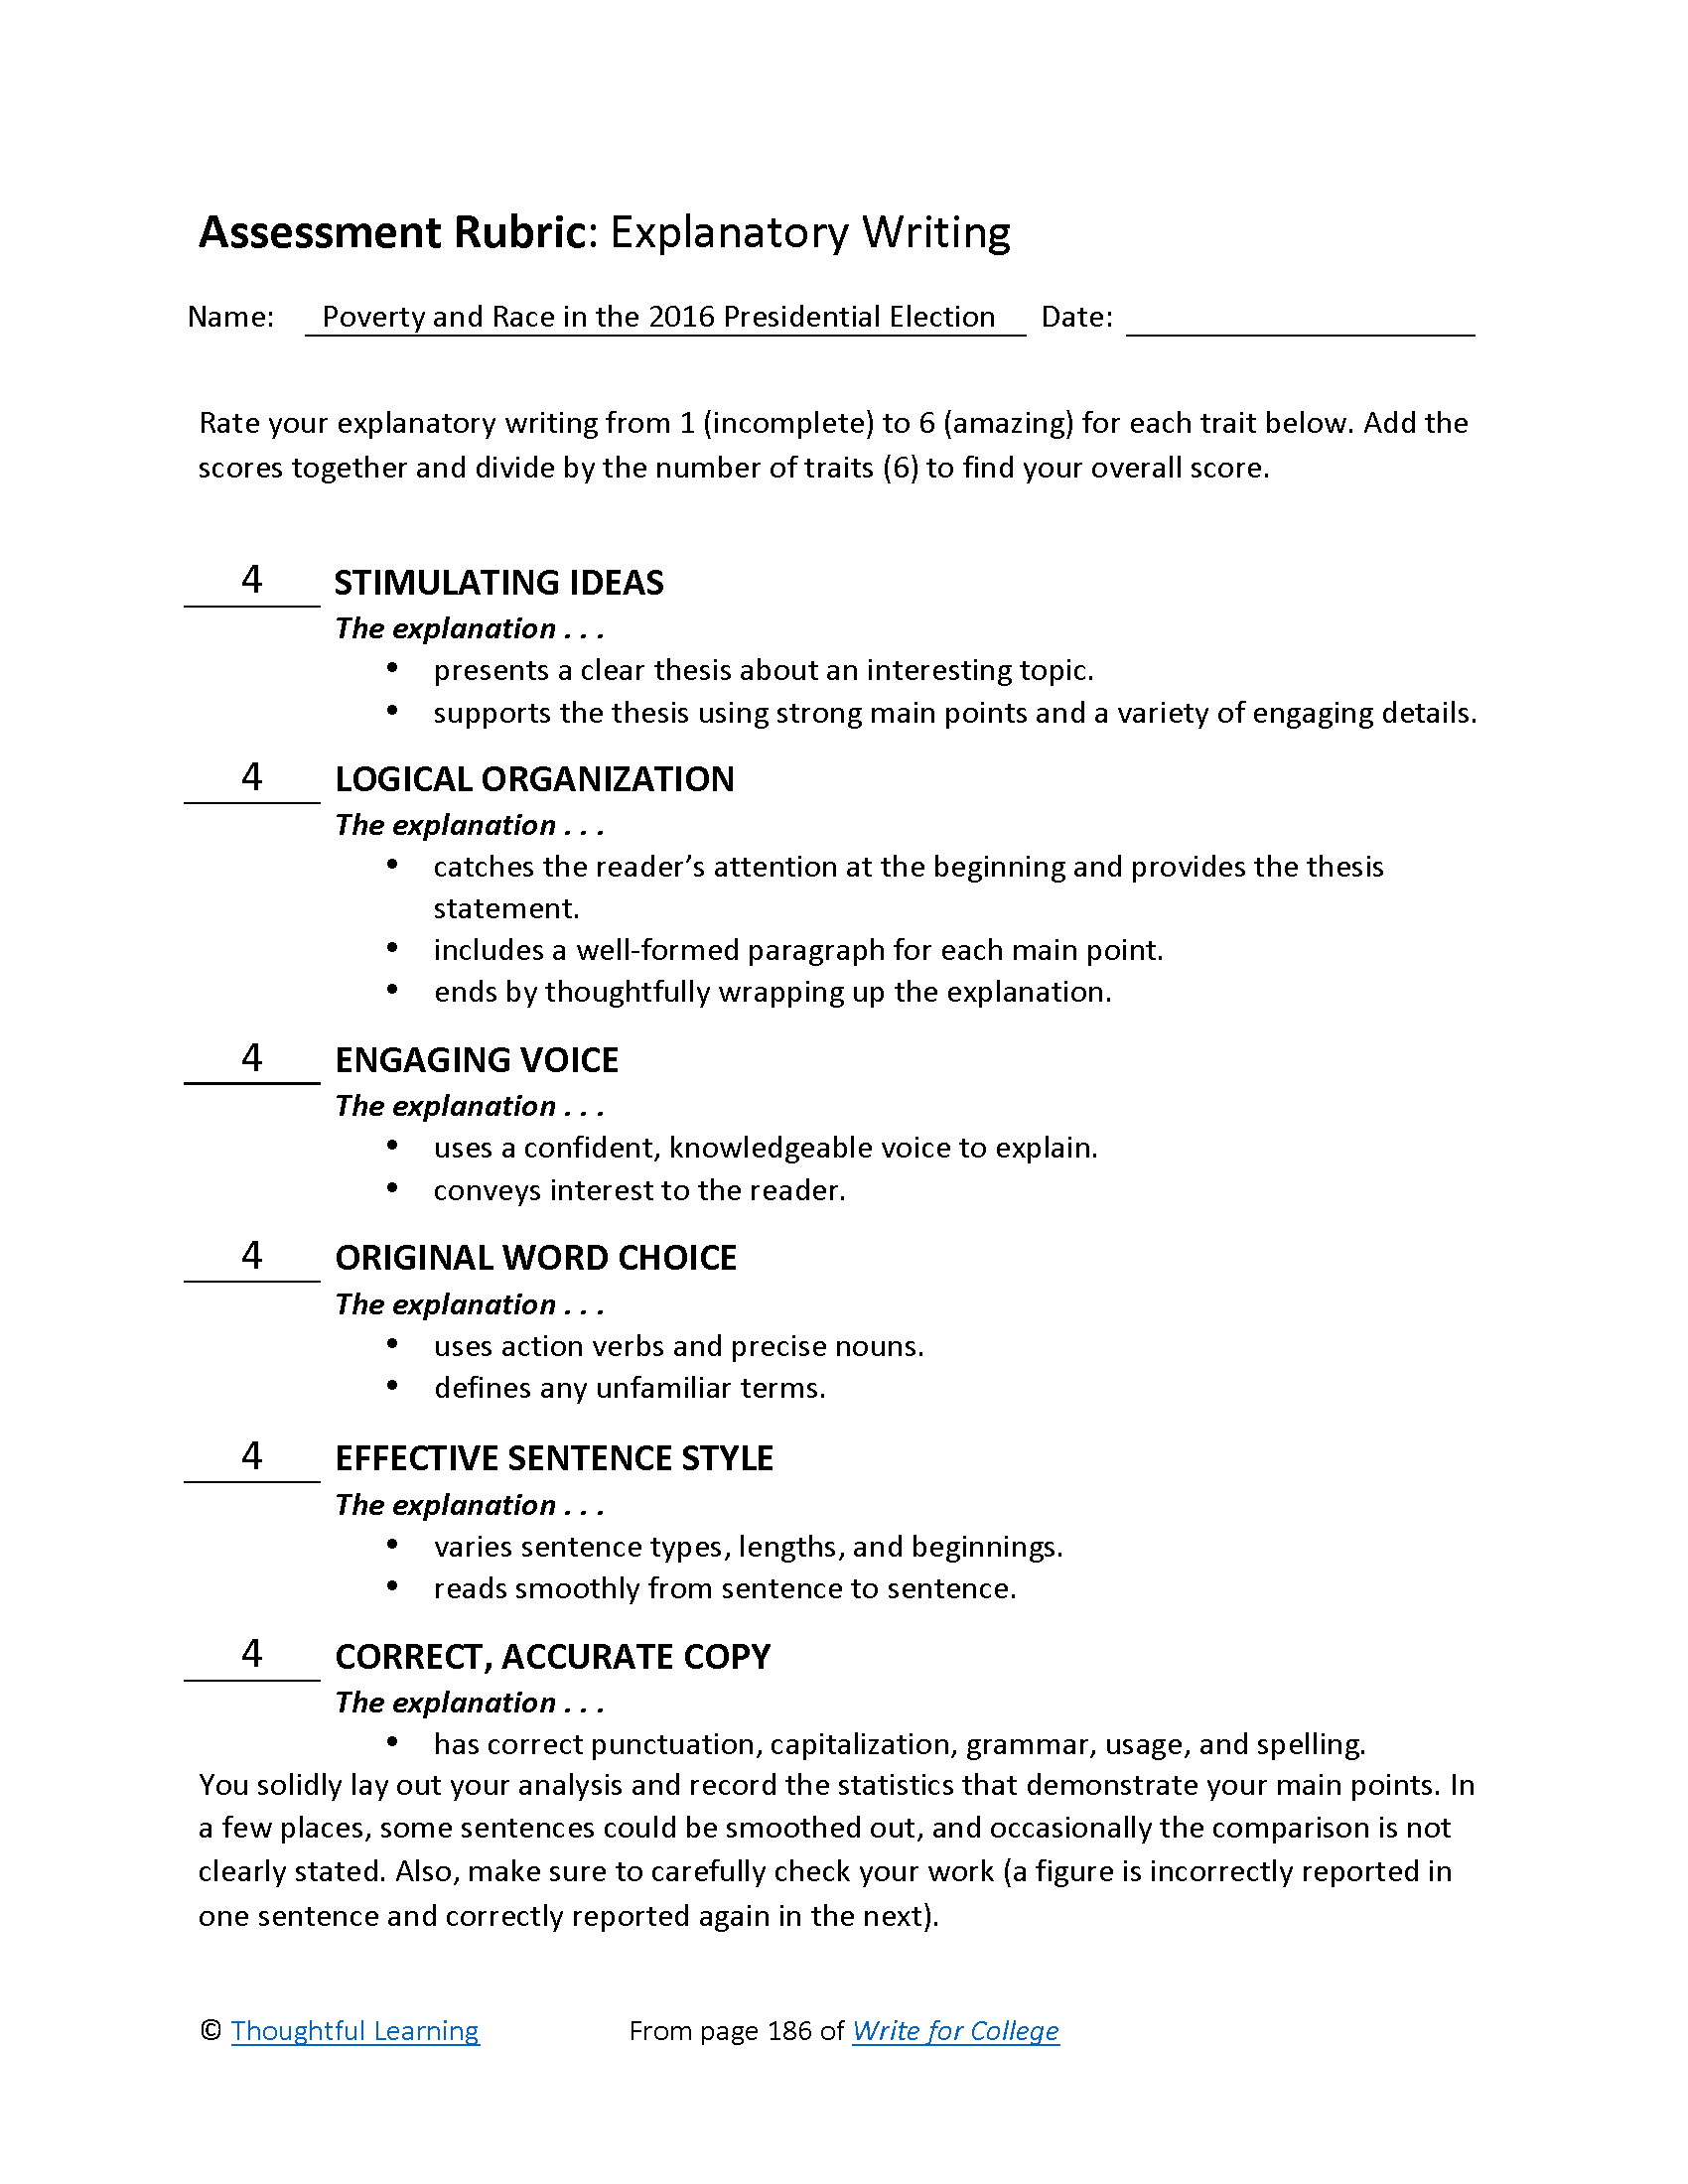
Rubric

Poverty and Race in the 2016 Election by Thoughtful Learning is licensed under a Creative Commons Attribution-NonCommercial-ShareAlike 4.0 International License.
Based on a work at k12.thoughtfullearning.com/assessmentmodels/poverty-and-race-2016-election.