Student Model
AP Stats Project
Sources
- Census
- Health and Human Services
- Election Results
Poverty-Rate Compared to Republican Vote:
- R=.508
- Predicted Republican Vote = 1.38 × Poverty Rate+26
- No pattern in residual plot.
- +1 percent poverty = +1.38 percent Republican vote
- Y-intercept is at 26.6
- S value = 7.497
- r²= .258
Non-Hispanic White Population Compared to Republican Vote
- R= .442
- Predicted Republican Vote=.335 × Non-Hispanic White +26.7
- +1 percent non-Hispanic whites = +.335 percent Republican votes
- Y-intercept is not necessary.
- S=7.806
- R²=.195
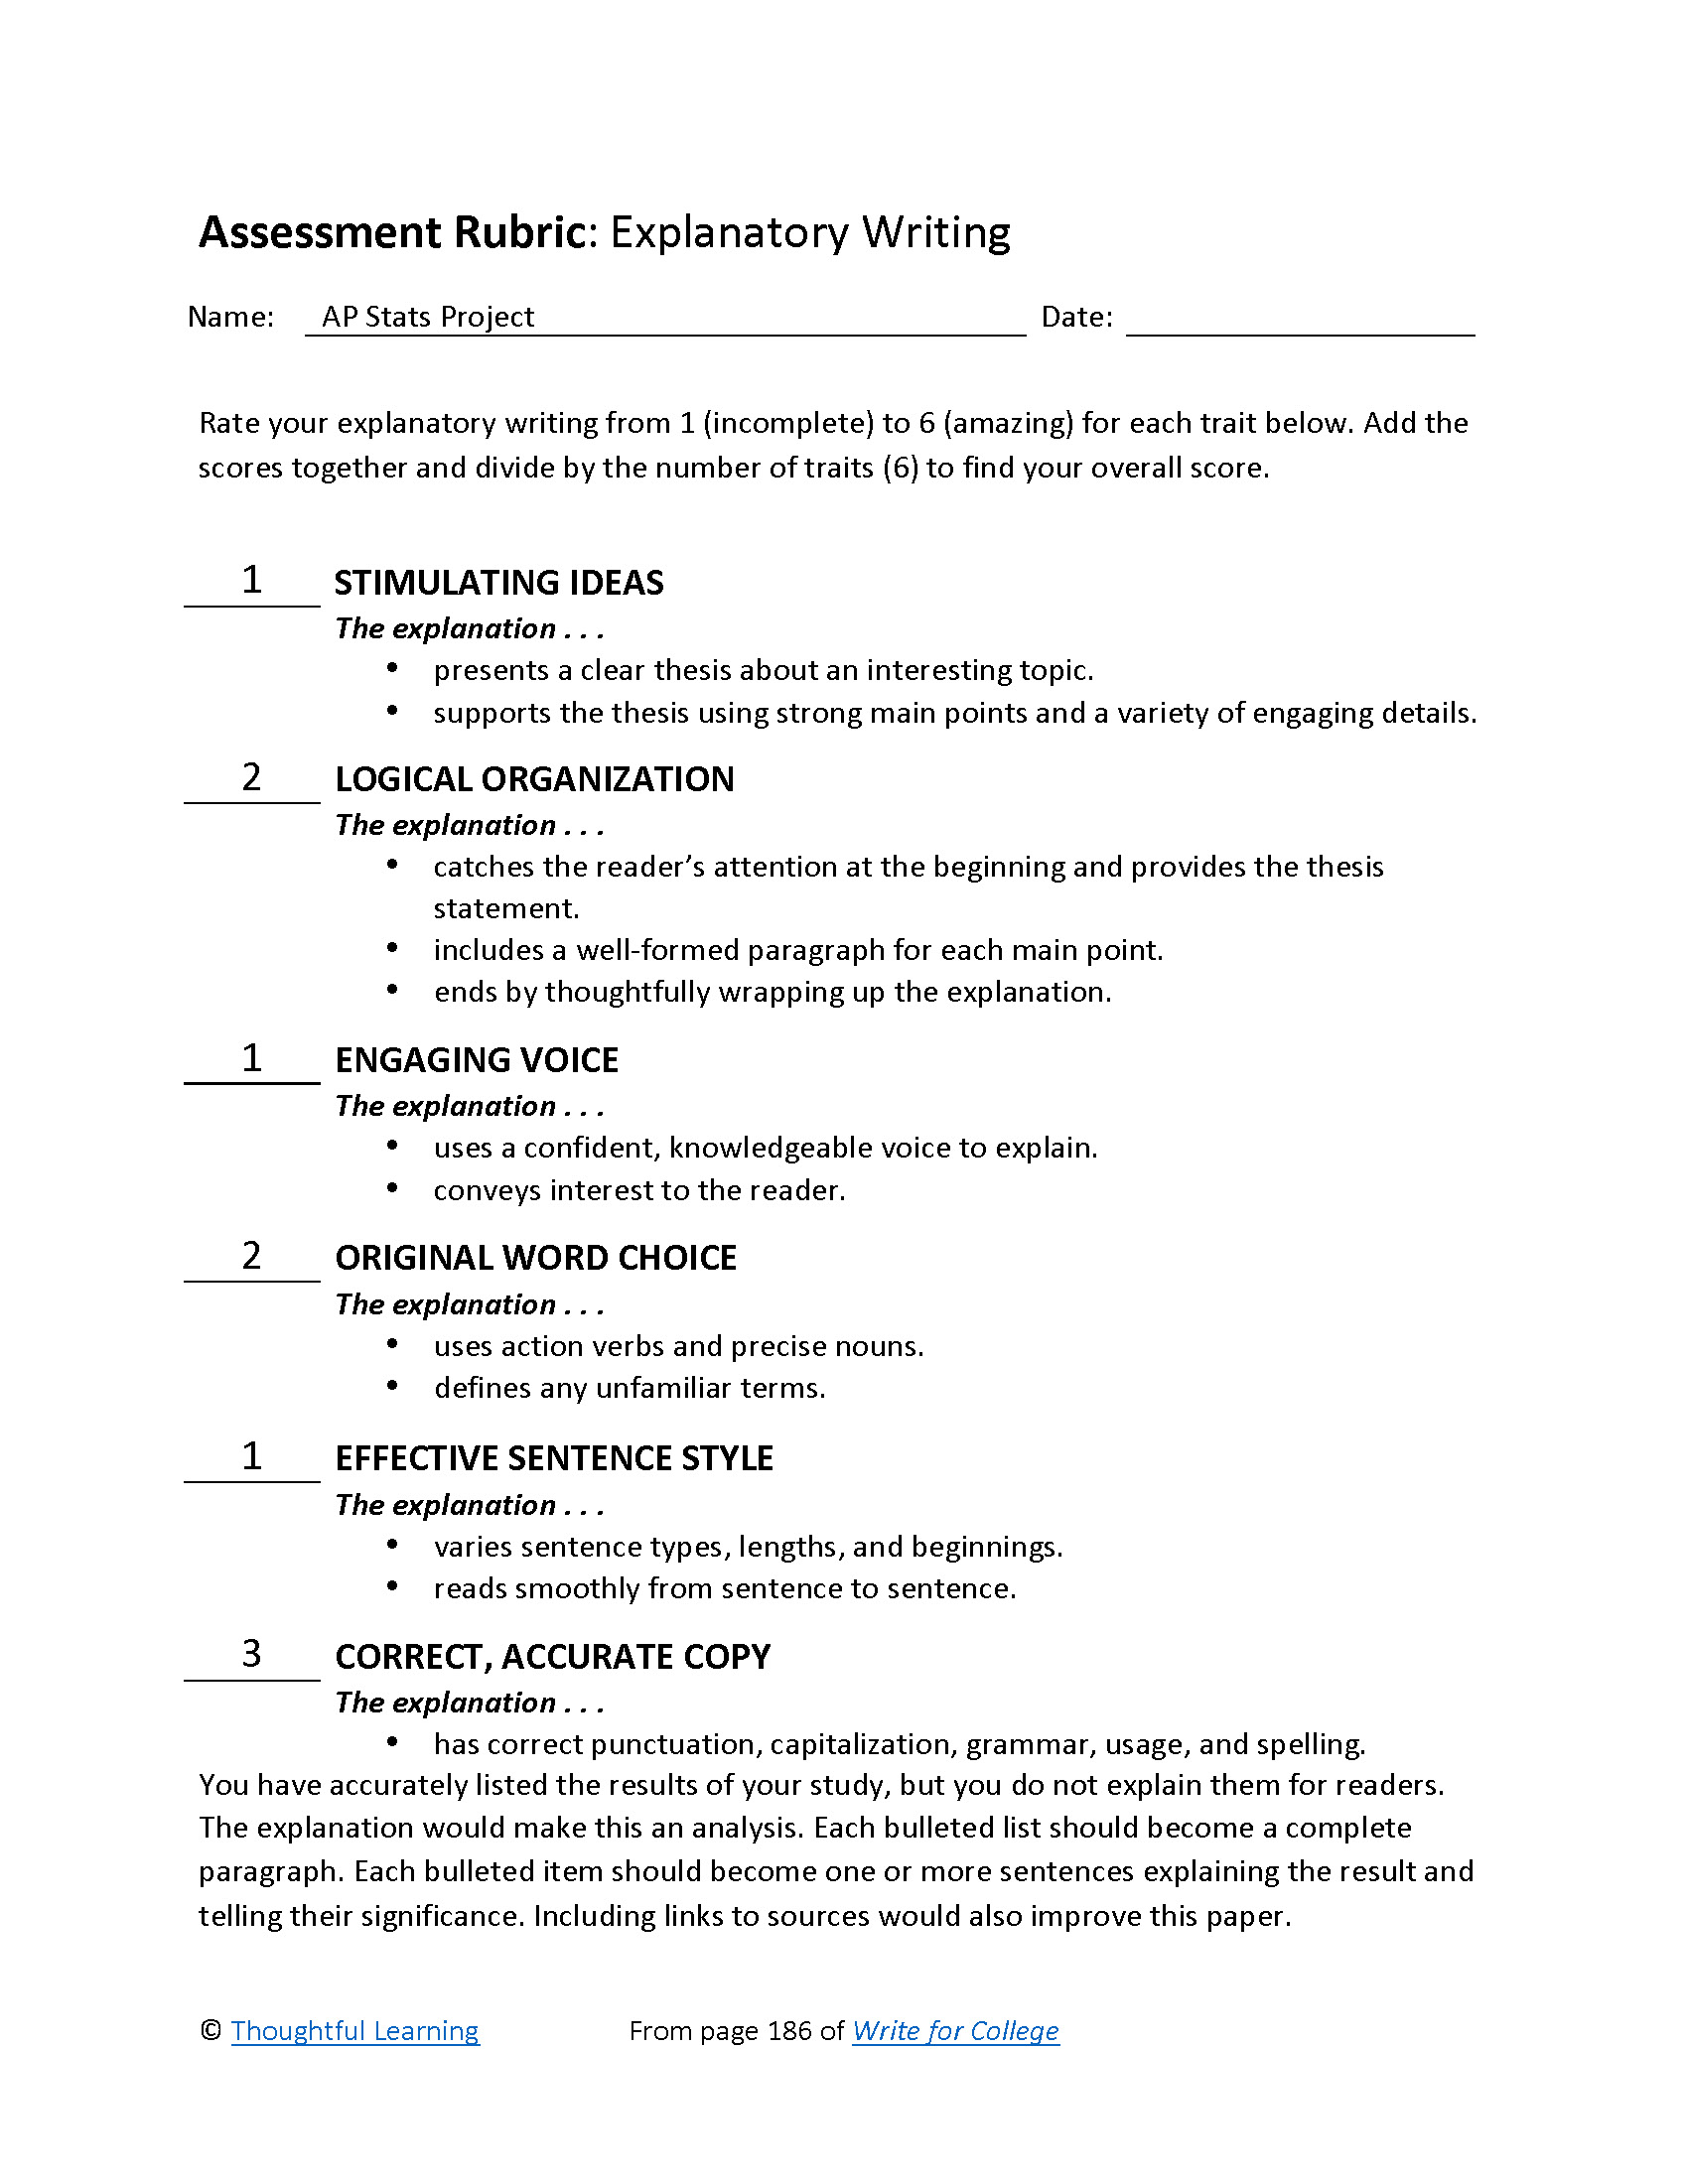
Rubric

Stats Analysis by Thoughtful Learning is licensed under a Creative Commons Attribution-NonCommercial-ShareAlike 4.0 International License.
Based on a work at k12.thoughtfullearning.com/assessmentmodels/stats-analysis.