Page 335
Line Graph 🟪 A line graph is drawn on a “grid.” The horizontal (left-to-right) side of the grid shows time passing. The vertical (top-to-bottom) side shows the subject of the graph. The line drawn through the grid lets you see the subject as it passes through time.
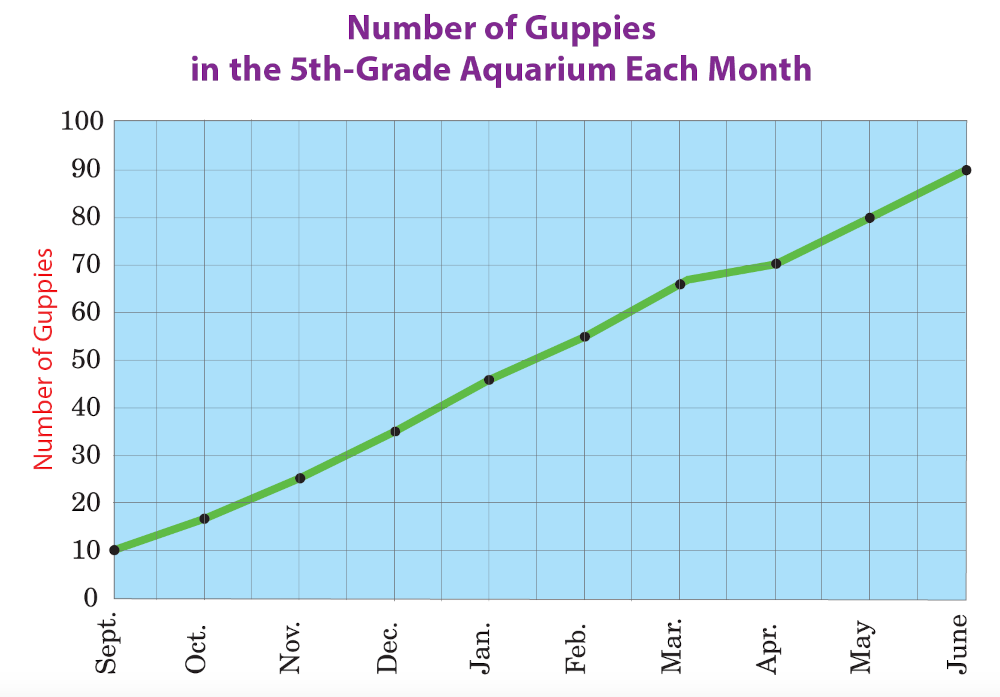
The line graph below shows how many guppies were in the 5th-grade aquarium in each month of the school year. “Number of guppies” is the subject of this graph, and time is measured in months (September through June).
© Thoughtful Learning 2024