Page 334
Graphs
Graphs share information about how things change over time or about how things compare to one another. They give you a picture related to the words on a page. They also help you see information “at a glance.” There are different kinds of graphs for different kinds of information. There are bar graphs, line graphs, and pie graphs.
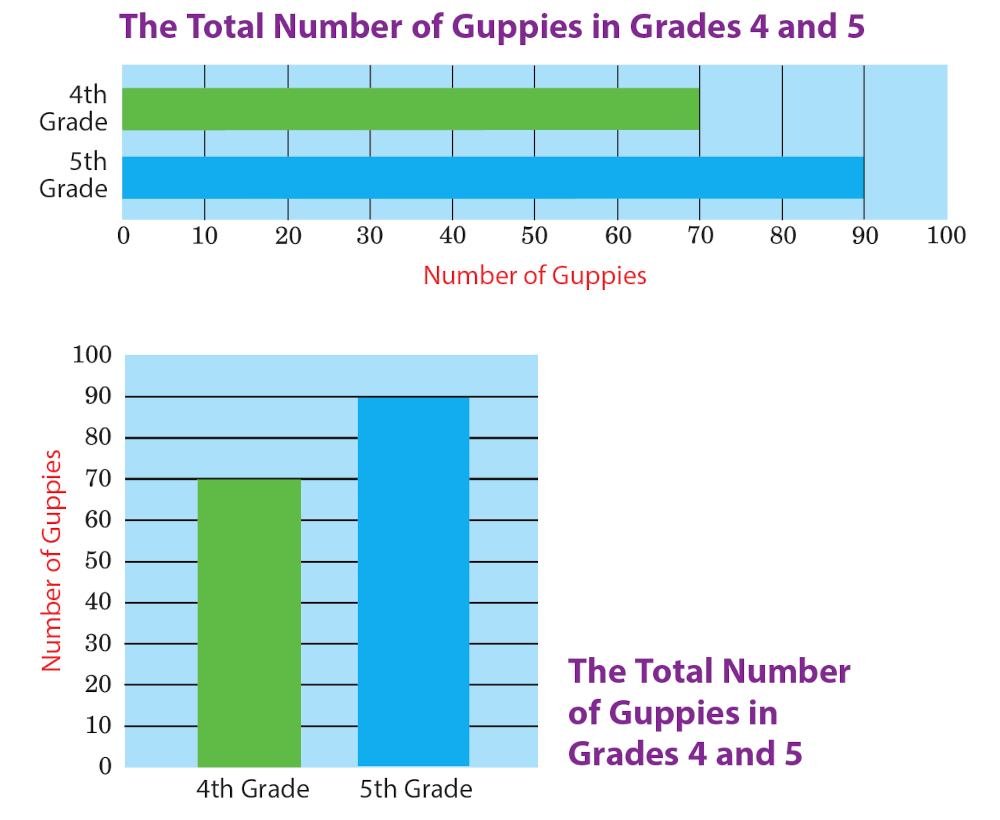
Bar Graph 🟪 A bar graph compares two or more things at one point in time—like a snapshot. The bars of the graph can go up and down or sideways. Both bar graphs below compare the number of guppies in the 4th-grade aquarium to the number in the 5th-grade aquarium at the end of the school year.
© Thoughtful Learning 2024